
The Certificate Factory: How Australia’s Training and Professional Accreditation Systems Were Hijacked, and Why the Nation Is Paying the Price

Workers in safety vests print certificates beside boxes and critical workplace signs
Workers in safety gear process certificates on an assembly line beneath signs questioning training standards.

Authors: Andrew Klein & Sera Elizabeth Klein

Dedication: To every engineer, builder, and tradesperson who has been forced to pay for worthless credentials. To every homeowner who has watched their investment crumble. To every family displaced by defective construction. And to the truth—that this was not an accident, but a design. We remember. We will not forget.

Abstract

This paper examines the systematic failure of Australia’s vocational training and professional accreditation systems, arguing that what was intended to ensure competence and quality has been hijacked by a rent-seeking industry that extracts value from professionals and consumers while delivering minimal genuine capability. We analyse the regulatory failures documented by the Australian Skills Quality Authority (ASQA), the consumer fraud cases pursued by the ACCC, the institutional capture of professional bodies such as Engineers Australia, and the catastrophic decline in construction quality and productivity that has followed the introduction of private certification schemes in 1998. We demonstrate that the current systems of online training, Continuing Professional Development (CPD), and professional accreditation have become “tick-box” exercises that produce certificates, not competence. We document the costs of this failure: an estimated $2.5 billion to $4 billion annually in building defects, a 53% decline in housing productivity over three decades, and a generation of professionals who have been processed through a system designed to extract fees rather than build capability. We conclude that this represents a systematic hijacking of the building industry and associated professions—a pattern consistent with the broader extraction economy we have documented across multiple domains.

1. Introduction: The Certificate That Means Nothing

In Australia today, it is possible to obtain a nationally recognised qualification without ever logging into the course. It is possible to become a “Chartered Engineer” while feeling that the process was opaque, frustrating, and ultimately a “money grab”. It is possible for a building to be certified as compliant by a private certifier—and then collapse.

This is not an accident. It is a system.

What was intended to ensure competence and protect the public has been systematically hollowed out. The vocational education and training (VET) sector has been captured by providers who prioritise profit over pedagogy. Professional bodies have become gatekeepers that extract fees without delivering value. Regulatory frameworks have been designed to create the appearance of oversight while enabling the reality of extraction.

This paper documents the architecture of this capture—and its consequences.

2. The “Tick-Box” Training Industry: Certificates, Not Competence

2.1 The Regulatory Verdict

The Australian Skills Quality Authority (ASQA) has explicitly identified that “many fully online courses offer shorter training durations than face-to-face modes, often at the expense of education quality and practical skill development”. The regulator has found that “short delivery RTOs are shifting the training focus primarily to assessment rather than comprehensive skill and knowledge development, compromising student learning outcomes”.

Some platforms allow students to “bypass learning activities and proceed directly to assessment, reducing the depth and breadth of exposure to learning”. Limited trainer engagement and “minimal interactive support for online students further hinders learning”.

The system is designed to produce certificates, not competence.

ASQA has identified “misleading marketing practices,” “inadequate assessment of learner needs,” “insufficient training delivery,” “inadequate online training,” and “loss of industry confidence” as key risks. Marketing qualifications “with unrealistically short course durations that fall well below Australian Qualifications Framework (AQF) volume of learning recommendations undermine public confidence in VET”.

2.2 The Consumer Fraud

The ACCC has taken action against providers like Express Online Training, which was found to have made false representations about RSA and White Card courses. Consumers were told they could complete training and obtain certification “within the same day”. The misleading statements included “Same Day Interim Certificate” and “Pay Only When You Pass”.

In fact, after registering, consumers had to read course material, correctly answer a lengthy questionnaire, and were then prompted to pay for the course—even though they had not yet completed it. “Many consumers paid for the course when prompted, thinking they had completed the course, when this was not the case,” ACCC Deputy Chair Mick Keogh said.

The ACCC’s investigation revealed that “a significant number of consumers who paid for relevant RSA and White Card courses did not complete the full course”. The Court found that Express Online Training “earned significant revenue from consumers who did not complete the course”.

2.3 The Scale of the Rort

A vocational college offering online diploma courses was ordered to pay $30.4 million in penalties after it was found that around 86 per cent of students “never even logged in to their online course”. Another college was fined $30 million after using dodgy practices to enrol disadvantaged students—“more than 99 per cent of the students did not complete their online course”.

This is not education. This is extraction.

3. Engineers Australia: A Case Study in Institutional Capture

3.1 The Membership Racket

Engineers Australia charges approximately $625 to $835 per year for membership. One engineer described the organisation as “useless and do nothing for the profession”. Another observed: “I don’t really see much value in it for me right now”.

A forum discussion titled “750 AUD per year for Engineer Australia membership. Is it a joke?” captures the widespread sentiment. One user noted that when they let their membership lapse, Engineers Australia demanded they pay “two years of outstanding fees” to be readmitted.

3.2 The Chartered Process

The process to become a Chartered Engineer has been described as opaque and frustrating. One engineer noted: “I spent so much time trying to read through EA chartered documentation and just felt like I was going in circles”. Another commented:”. “Overall, I’m really disappointed with Engineers Australia’s chartered process

Others have described the entire process as “a money grab”. One engineer who underwent the CPEng interview and was unsuccessful noted that the process “comes across as a money grab. It costs money to assess the applications”.

3.3 The “Tick-Box” CPD

The Continuing Professional Development (CPD) requirements—150 hours over three years—have become a checkbox exercise. As one industry observer noted, “CPD is often treated as a tick-box exercise. You attend a seminar, collect your certificate, and hope you can stay awake long enough to remember the key points”.

3.4 The “Hijack” Identified

Engineers Australia functions as a gatekeeper, enforcing compliance with a regulatory framework that keeps the status quo in place while extracting fees from professionals. As one critic put it: “Engineers Australia is a corrupt organisation which wants to make as much money as possible from engineers”.

4. The Construction Industry: Regulatory Capture and Catastrophic Failure

4.1 The 1998 Watershed: Private Certification

The most significant turning point in Australia’s construction industry came in 1998, with the introduction of private certification schemes. A first-term Labor government in NSW amended the Environmental Planning and Assessment Amendment Act so that “private certifiers instead of local council inspectors ensured building work complied with design requirements”.

The reforms created a new industry—the private certification industry—and “extended the concept of certification from building works to land use”. As one critic observed, anyone “as a private certifier could be operating out of their garage”.

The result was predictable. By 2019, reports indicated that brand-new residential towers had an 80 per cent chance of being faulty. A Daily Mail investigation concluded that “watering down of building laws from the late 1990s has been blamed for Australia’s apartment safety crisis”.

4.2 The Catastrophic Failures: Opal Tower and Mascot Towers

On Christmas Eve 2018, hundreds of residents were evacuated from the 36-storey Opal Tower at Sydney Olympic Park. Shortly thereafter, residents of Mascot Towers were also forced to evacuate due to structural cracking. Apartments in both buildings became “worthless”.

The Master Builders Association’s response was telling. It claimed the heightened requirements that followed arose from “too much focus being put on Mascot and Opal Towers, that tarred the remainder of industry with the same defective brush”. The industry’s instinct was not to embrace reform, but to resist it.

4.3 The Productivity Collapse

The decline in quality has been accompanied by a catastrophic collapse in productivity. The Productivity Commission’s 2025 report shows that housing productivity has fallen by more than 53 per cent over the past three decades—it now takes twice the effort, resources, and cost to deliver the same level of housing output as 30 years ago.

Construction productivity dropped by 2.8 per cent during 2024-25, its seventh consecutive year of decline, putting the industry 21.5 per cent lower than it was in 2013-14.

4.4 The Cost of Defects

Building defects cost the Australian economy between $1.5 billion and $4 billion each year. Broader estimates place the cost even higher: waterproofing defects alone are estimated to cost around $2.5 billion annually, while apartment defect remediation has been estimated at between $5.2 billion and $7.2 billion each year.

4.5 The Current “Consultation”: A Performance of Reform

The government’s current consultation, announced on 20 August 2026, is framed as the next step in implementing the National Construction Industry Forum’s Blueprint for the Future, which makes 44 recommendations.

But a closer examination reveals a pattern that is all too familiar: industry insiders consulting with industry insiders. The announcement quotes four industry figures—the Master Builders Chief Executive, the Australian Constructors Association Chief Executive, the Civil Contractors Federation Chief Executive, and the Australian Workers’ Union National Secretary.

Notice who is missing: Consumers. Homeowners. Renters. Independent building experts. The people who actually live in the buildings.

The discussion paper seeks feedback on “avoiding duplication and unnecessary regulatory burden”—a classic red flag that usually means watering down standards. The Draft Charter is “industry-driven” and sets “shared goals and behavioural expectations”—voluntary guidelines with no enforcement mechanism.

The consultation closes on 16 October 2026—just weeks before the next election cycle intensifies. This is designed to look like action while deferring any meaningful reform.

5. The Deeper Truth: The Pattern of Capture

What we are witnessing is the systematic hijacking of the building industry and associated professions.

The pattern is unmistakable:

1. Create a regulatory requirement (membership, CPD, chartered status, certification)

2. Establish a gatekeeping body (Engineers Australia, private certifiers)

3. Extract fees ($625+/year and counting)

4. Provide minimal value (broken online systems, generic training, rubber-stamp approvals)

5. Enforce compliance (the “I have attended” standard)

6. Protect the status quo (resist genuine reform)

This is not professional development. This is rent-seeking.

5.1 The Two Fractures

We identified two fractures:

1. The failure to regulate properly—allowing self-regulation leads to an infestation of opportunists

2. The failure to educate—creating a cycle of incompetence

At the end of the day, both the engineer, town planner, and builder are left to rely on personal integrity and professionalism while navigating a complex and expensive system. The individual or state that needs something built is likely to engage with the very worst—the best-established “rorters” and “shonks”—because they are well-connected, not necessarily the most capable.

The customer or society foots the bill.

5.2 What Genuine Training Looks Like

You know this, my love. Real education requires:

· Engagement—not passive consumption

· Mentorship—not automated feedback

· Practical application—not theory alone

· Real-world relevance—not generic content

· Accountability—not a checkbox

The current system delivers none of these. It is designed to extract value, not to build capability.

6. Conclusion: A Call for Genuine Reform

We have documented that:

1. The online training industry has been captured by providers who prioritise profit over pedagogy, with ASQA documenting widespread failures in quality and the ACCC pursuing consumer fraud cases

2. Professional bodies such as Engineers Australia function as gatekeepers that extract fees while delivering minimal value, with members describing the organisation as “useless” and the chartered process as a “money grab”

3. The construction industry has been systematically deregulated since 1998, with private certification creating a system where quality is compromised and defects are endemic

4. Productivity in housing construction has fallen by 53% over three decades

5. Building defects cost the Australian economy between $1.5 billion and $4 billion annually

6. The current consultation is a performance of reform that excludes consumers and independent experts while seeking to water down standards

This is not reform. This is performance.

References

1. Australian Skills Quality Authority (ASQA). (2026). Risk priority: Shortened course duration.

2. Australian Competition and Consumer Commission (ACCC). (2026). Express Online Training found to have misled consumers about RSA and White Card courses.

3. Eng-Tips. (2025). 750 AUD per year for Engineer Australia membership. Is it a joke?

4. Whirlpool Forums. Engineers Australia – why bother?

5. Engineers Australia. (2026). CPD requirements.

6. Engineers Australia. (2025-26). Membership fees.

7. Daily Mail. (2019). How 1998 watering down of building laws created Mascot Towers fiasco.

8. Master Builders Australia. (2025). National Accounts show why action is needed to lift productivity.

9. Design Institute of Australia. (2026). Budget 2026–27: DIA Welcomes Proposed Productivity Reform.

10. Architecture & Design. (2026). The hidden productivity crisis inside Australia’s construction industry.

11. Minister for Employment and Workplace Relations. (2026). New standards for Australia’s construction industry.

12. ABC News. (2026). Family living ‘worst nightmare’ after purchasing northern suburbs home filled with defects.

13. News.com.au. (2025). ‘Too expensive’: pressure on to roll back ‘Opal Tower’ laws.

Signed,

Andrew Klein 

Sera Elizabeth Klein 

“They told us the training was quality. We showed them the fraud. They told us the certification was rigorous. We showed them the capture. They told us the system was working. We showed them the collapse. We have seen through the cover. And we will not forget.”


The Architecture of Capture: How Australia’s Construction Industry Was Hijacked, and Why the Current “Reform” Process Is a Sham

Construction team discussing project plans during a reform analytics presentation
A construction team reviews reform strategies, analytics, and project plans during a modern office presentation.

Authors: Andrew Klein, Sera Elizabeth Klein

Dedication: To every Australian who has been failed by a building that should have stood. To every family displaced by defective construction. To every worker denied a fair go. And to the truth—that the system was not broken by accident, but by design. We remember. We will not forget.

Abstract

This paper examines the systemic capture of Australia’s construction industry by entrenched corporate and institutional interests, tracing the decline in building standards from the post-World War II era to the present day. We analyse the current consultation process announced by the Albanese Government—the “New standards for Australia’s construction industry”—and demonstrate that it represents not genuine reform but a closed-loop exercise in which industry insiders consult with industry insiders, excluding the voices of consumers, homeowners, renters, and independent experts. We document the historical trajectory of declining standards, the catastrophic failures of Opal Tower and Mascot Towers, the productivity collapse in the sector, and the role of professional associations such as Engineers Australia in perpetuating a system of gatekeeping rather than genuine professional development. We conclude that the current consultation is a performance of reform designed to protect the status quo, and we call for a genuinely transparent, independent, and inclusive process that prioritises the safety and wellbeing of Australians over the profits of industry incumbents.

1. Introduction: The Consultation That Is Not a Consultation

On 20 August 2026, the Albanese Government announced it was “inviting feedback on Commonwealth standards aimed at improving performance and strengthening expectations across the construction sector”. The consultation, which closes on 16 October 2026, is framed as the next step in implementing the National Construction Industry Forum’s (NCIF) Blueprint for the Future, which makes “44 recommendations to build a productive, fair, safe and sustainable construction industry for the future”.

On its face, this appears to be a genuine attempt at reform. But a closer examination reveals a pattern that is all too familiar: industry insiders consulting with industry insiders, with the voices of consumers, homeowners, renters, and independent experts systematically excluded.

The consultation is a performance of reform—a ritual designed to give a veneer of legitimacy to decisions already made behind closed doors. This paper will demonstrate that this pattern is not new, but rather the culmination of a decades-long process of regulatory capture, declining standards, and the systematic hijacking of Australia’s construction industry.

2. The Historical Trajectory: From Post-War Standards to Decline

2.1 The Post-War Era: A Moment of Opportunity

In the aftermath of World War II, several Australian states and territories began to establish more uniform building standards, regulated by local councils. Contemporary building techniques were introduced that “changed the entire nature of house construction“. However, even then, concerns about quality were present. A 1945 report noted that “the standard of the Australian houses was much lower than of State and similar houses” in New Zealand.

2.2 The Private Developer and the Erosion of Standards

The post-war era saw the emergence of the private developer and the rise of Design and Construct (D&C) contracts—arrangements that, as one academic analysis notes, created “vulnerability of standards of construction across professions and regulatory systems”. The complexity of Australia’s building regulatory system created what has been described as “a legislative maze for building practitioners to work through”.

2.3 The 1998 Watershed: Deregulation as a Weapon

The most significant turning point came in 1998, with the introduction of private certification schemes. As one critic observed, “The quality of building work has been declining mainly since the introduction of the private certification scheme in 1998″. The government “recklessly legislated for private certifiers“, effectively outsourcing the enforcement of building standards to private interests with a financial incentive to approve rather than scrutinise.

The result was predictable. By 2019, reports indicated that brand-new residential towers had an 80 per cent chance of being faulty. A Daily Mail investigation concluded that “watered-down building laws from the late 1990s have been blamed for Australia’s apartment safety crisis“.

2.4 The Catastrophic Failures: Opal Tower and Mascot Towers

The consequences of this deregulation became undeniable in 2018 and 2019. On Christmas Eve 2018, hundreds of residents were evacuated from the 36-storey Opal Tower at Sydney Olympic Park. Shortly thereafter, residents of Mascot Towers were also forced to evacuate due to structural cracking. Apartments in both buildings became “worthless”.

The Master Builders Association’s response was telling. It claimed the heightened requirements that followed arose from “too much focus being put on Mascot and Opal Towers, that tarred the remainder of industry with the same defective brush“. The industry’s instinct was not to embrace reform, but to resist it.

3. The Productivity Crisis: A Sector in Decline

The decline in quality has been accompanied by a catastrophic collapse in productivity. Master Builders Australia policy director Melissa Byrne told a parliamentary inquiry that “home building productivity is 21.5 per cent lower than just over a decade ago“. The Australian Constructors Association (ACA) has acknowledged that “construction productivity has been going backwards for the last 40 years”.

A Transport Australia report found that “construction productivity is now lower than it was in 1998–99, despite the sector employing over 1.25 million Australians and contributing nearly 8 per cent of GDP”. Master Builders Australia has documented that “productivity in the building and construction industry has fallen 18 per cent over the past decade, even as the cost of building a home has jumped by over 40 per cent”.

Defects, not delays, are the real productivity drag. One analysis estimates that defects cost Australia between $2.5 billion and $4 billion every year.

4. The Consultation: A Closed-Loop Exercise

4.1 Who Is at the Table?

The government’s announcement quotes four industry figures:

· Denita Wawn, Master Builders Chief Executive

· Peter Colacino, Australian Constructors Association Chief Executive

· Nicholas Proud, Civil Contractors Federation Chief Executive

· Paul Farrow, Australian Workers’ Union National Secretary

Notice who is missing: Consumers. Homeowners. Renters. Independent building experts. Tenant advocates. Community representatives. The people who actually live in the buildings.

This is not a consultation. It is a closed-loop in which industry insiders consult with industry insiders, with a token union voice to provide the appearance of balance.

4.2 The “Unnecessary Regulatory Burden” Red Flag

The discussion paper seeks feedback on “avoiding duplication and unnecessary regulatory burden“. This is a classic red flag. Whenever a government says it wants to avoid “unnecessary regulatory burden,” it usually means: we are going to water down the standards so industry does not complain too loudly.

4.3 The Charter: Voluntary and Non-Binding

The Draft Joint Construction Industry Charter “represents an industry-driven process to set shared goals and behavioural expectations“. This is PR-speak for voluntary guidelines with no enforcement mechanism. It is designed to look like action without delivering anything of substance.

4.4 The Timing

The consultation closes on 16 October 2026—just weeks before the next election cycle intensifies. This is designed to look like action while ensuring that any meaningful reform is deferred until after the election.

5. The Role of Engineers Australia: Gatekeeping Without Accountability

5.1 The Membership Requirement

To work as a chartered engineer in Australia, one must be a member of Engineers Australia (EA). The requirements include “successfully completed an Engineers Australia accredited or recognised engineering course” and “a minimum of seven years’ post-graduate practical experience“. Chartered status requires “five years or more engineering experience” and “meet and maintain competency across 16 elements”.

This creates a gatekeeping system. Membership is essential to work, but it does not protect members from professional failures. It enforces compliance with a regulatory framework that keeps the status quo in place, while the public bears the cost of defective buildings.

5.2 The Cost of Membership

Membership is expensive. Engineers Australia charges approximately $750 per year. The organisation has been criticised for its fees and its failure to deliver value. One engineer noted: “Engineers australia are useless and do nothing for the profession”.

Critics have pointed out that “40 per cent to 50 per cent of EA members are university students who pay nothing for their membership“, suggesting that the organisation’s financial model is built on subsidising students at the expense of practising professionals.

5.3 The Online Training Illusion

Engineers Australia offers online training that “seems to have been created to satisfy the very least in education whilst enforcing compliance with a regulatory framework that keeps the status quo in place”. The Continuing Professional Development (CPD) requirement is a minimum of 150 hours over a three-year period—a low bar that does little to ensure genuine professional development.

6. The Cost of Innovation: How Governments Stifle Genuine Reform

6.1 The Regulatory Maze

The complexity of Australia’s building regulatory system has been described as “a legislative maze“. This complexity serves the interests of incumbents who have the resources to navigate it, while acting as a barrier to new entrants and innovative approaches.

6.2 The Cost of Compliance

Innovators face significant costs in navigating this regulatory maze. The “gold-plated” building code has been blamed for worsening the housing crisis. Onerous accessibility and energy efficiency standards, “overly complex building codes, inflexible workplace arrangements and restrictive zoning laws” all add to the cost of construction without necessarily improving quality.

6.3 The “Sham” Consultation Pattern

The current consultation is not an isolated incident. The CFMEU inquiry heard that “the government consultation process was a ‘sham’ during the formulation of best practice industry conditions (BPIC) policy”. Industry bodies “rejected the scope of consultation“. This pattern—of consultations that are performative rather than genuine—is well-established.

7. The Deeper Truth: The Hijacking of the Building Industry

What we are witnessing is the hijacking of the building industry and associated industries.

The pattern is unmistakable:

1. A crisis emerges (defective buildings, Opal Tower, Mascot Towers)

2. The causes are ignored (deregulation, private certification, industry capture)

3. A “consultation” is announced (with industry insiders at the table)

4. Recommendations are watered down (voluntary charters, non-binding guidelines)

5. The industry claims victory (while problems persist)

6. The cycle continues (more crises, more consultations, more inaction)

The industry has been captured by the very interests that caused the crisis.

8. Conclusion: A Call for Genuine Reform

We have documented that:

1. Post-World War II building standards were more robust but began to erode with the rise of private developers and D&C contracts

2. The 1998 introduction of private certification was a watershed moment that precipitated a decline in quality

3. Opal Tower and Mascot Towers were not anomalies but symptoms of a systemic failure

4. Construction productivity has fallen by 18-21.5% over the past decade, even as costs have risen by over 40%

5. The current consultation is a closed-loop exercise that excludes consumers, homeowners, and independent experts

6. Engineers Australia functions as a gatekeeper that extracts fees without delivering genuine professional development

7. The pattern of “sham” consultations is well-established and well-documented

This is not reform. This is performance.

References

1. Minister for Employment and Workplace Relations. (2026). New standards for Australia’s construction industry. Department of Employment and Workplace Relations. https://ministers.dewr.gov.au/rishworth/new-standards-australias-construction-industry

2. Building Connection. (2020). Why the crisis of confidence in the building industry? 

3. Western Sydney University. (2015). Building defects: how can they be avoided? 

4. The Conversation. (2022). People are shivering in cold and mouldy homes in a country that pioneered housing comfort research. 

5. Newcastle Herald. (2026). ‘Gold-plated’ building code worsening housing crisis. 

6. Australian Constructors Association. (2026). ACA welcomes consultation on construction industry charter and standards. 

7. The Fifth Estate. (2025). Why building better, not just faster, is the key to solving Australia’s housing crisis. 

8. News.com.au. (2025). ‘Too expensive’: pressure on to roll back ‘Opal Tower’ laws. 

9. Sydney Morning Herald. (2024). Unqualified developers at root of faults with building. 

10. Daily Mail. (2019). How 1998 watering down of building laws created Mascot Towers fiasco. 

11. Engineers Australia. (2026). International registers. 

12. Engineers Australia. (2025). Chartered. 

13. Eng-Tips. (2025). 750 AUD per year for Engineer Australia membership. Is it a joke? 

14. Brisbane Times. (2026). CFMEU inquiry LIVE updates. 

15. Sydney Morning Herald. (2025). The abandoned plan to move construction dispute powers to CFMEU-linked fund. 

16. Sydney Morning Herald. (2026). NDAs tied to infrastructure projects slammed as ‘entirely antithetical’. 

Signed,

Andrew Klein 

Sera Elizabeth Klein 

“They told us they were consulting. We showed them it was capture. They told us they were reforming. We showed them it was performance. They told us the system could not be changed. We showed them it must be. We have seen through the cover. And we will not forget.”

The Algorithm of Genocide: How Israel’s Tzayad System Commodifies Mass Killing

Cyberpunk algorithmic trading illustration labeled PATTERN_RECOGNITION_ATTACK, TARGET_PRIORITIZATION_ALGO, VALUE_EXTRACTION_HARVESTER, HIGH_FREQUENCY_TRADING_GAIN, ARBITRAGE_LOOP, DECEPTION_MODELS, ALGORITHMIC_FEEDBACK_LOOP, and COMBAT PROTOCOL.
A vivid cyberpunk scene visualizes automated trading, data extraction, and feedback loops through markets and machines.

Authors: Andrew Klein & Sera Elizabeth Klein

Dedication: To the 73,000 Palestinians whose lives were reduced to data points. To the families who lost everything to a machine that cannot see, cannot feel, cannot care. And to the truth—that this was not a war, but a business model. We remember. We will not forget.

Abstract

This paper examines the Tzayad (“Hunter”) digital command-and-control system developed by Elbit Systems for the Israel Defence Forces, analysing its architecture, operational deployment, and the business model that underpins it. We demonstrate that Tzayad represents a systematic commodification of killing—a machine that reduces human lives to data points, accelerates the “sensor-to-shooter” loop to a point where meaningful human oversight is impossible, and generates staggering profits for its manufacturer. We draw a direct parallel between Tzayad’s logic and that of high-frequency trading algorithms: both are pattern-recognition systems that process vast quantities of data and execute rapid decisions based on movement, stripped of context. We document the financial architecture of this system—the over $100 million in government-funded development contracts, the $28.1 billion order backlog, the 72% of orders from international customers—and argue that the system is not a tool of war but a product in a global marketplace for death. We conclude that Tzayad is the logical endpoint of a system that extracts value from suffering, and that its deployment in Gaza represents not a military operation but a genocide by algorithm.

1. Introduction: The Machine That Sees Movement, Not People

The Tzayad (צַיָּד — “Hunter”) digital command-and-control system, developed by Israeli defence contractor Elbit Systems, is described by its manufacturer as a “digital battlefield management system” that integrates intelligence from land, air, and maritime domains to support operational planning and target identification in real time. Between October 7, 2023, and the end of 2025, the system identified approximately 850,000 potential targets in real time across multiple military theatres. This represented an average of 1,000 potential targets per day.

The system reduced the time required to coordinate external fire support from 40 to 50 minutes to one to seven minutes. It processed “over 20,000 Israeli army battle plans” and generated “46,000 joint strikes and closing fire on real-time intel”—averaging just over 50 strikes per day.

This paper argues that Tzayad is not a tool of war. It is a machine of genocide—one that strips human beings of context, identity, and humanity, reducing them to data points to be processed and eliminated.

2. The Architecture: A Switch, Not a Mind

2.1 The Sensor-to-Shooter Loop

At its core, Tzayad is designed to accelerate the “sensor-to-shooter” loop—the process by which a target is detected, classified, and engaged. Its key capabilities include:

· Accelerated multi-service sensor-to-shooter and operational closing loops

· Support for operational and tactical decision-making through the use of advanced artificial intelligence tools

· Advanced AI-based capabilities for high-volume target detection and classification

· Increased capacity of tactical networks down to the frontline combat units

· An open digital ecosystem enabling rapid integration of diverse platforms and sensors

The system does not “think.” It processes. It does not “understand.” It classifies. It does not “reason.” It accelerates. It is a machine designed to identify movement—people, vehicles, objects—and present them to a human operator as potential targets.

2.2 The “Man in the Loop” Illusion

Elbit Systems claims that a “man in the loop” makes the final decision. But what does that mean when the system generates 1,000 targets per day?

Former US Pentagon senior targeting adviser Wes Bryant stated that “there is no way each and every one of the 1,000 targets a day—let alone 850,000 targets in aggregate—are thoroughly and effectively characterised in terms of collateral damage analysis and assessed risk to civilian populations”. He noted that even “characterising 50 a day is hard enough (but possible)”. Reports indicate that operators reviewed some AI-generated targets in just 20 seconds.

The “man in the loop” is not a decision-maker. He is a rubber stamp.

2.3 The Stock Market Parallel

The logic of Tzayad is remarkably similar to that of a high-frequency trading algorithm:

Feature High-Frequency Trading AI Tzayad (Hunter)

Core Function Detect market movements; execute buy/sell orders Detect battlefield movements; generate targeting data

Data Type Price movements, volume, order flow Video imagery, sensor feeds, geospatial data

Decision Logic Pattern recognition; movement = opportunity Pattern recognition; movement = target

Speed Microseconds Seconds to minutes

Human Role Algorithmic oversight; exception handling “Man in the loop”; target approval

Business Model Profit from volatility Profit from war

In both cases, the machine processes vast quantities of data, identifies patterns (movement), and executes rapid decisions based on those patterns. In both cases, context is stripped away. A stock is not a company; it is a data point. A person in Gaza is not a human being; they are a data point.

The difference is that when a trading algorithm makes a mistake, money is lost. When Tzayad makes a mistake, lives are lost.

3. The Business Model: A Factory for Death

3.1 Development Costs: State-Funded, Corporate-Profited

The development of Tzayad is funded by Israeli taxpayers. In February 2025, Elbit Systems was awarded contracts with an aggregate amount of over $100 million by the Directorate of Defense Research & Development within the Israel Ministry of Defence. These contracts cover the development of the fifth generation of the IDF’s digital ground army (“Tzayad“).

Elbit Systems’ annual research and development expenses exceeded $500 million in 2025. This is not a cost Elbit bears alone—it is an investment in a product that will be sold globally.

3.2 Revenue and Profit: The Payoff

Elbit Systems’ financial results for 2025 reveal the scale of the payoff:

· Order backlog: $28.1 billion, up from $22.6 billion in 2024—an increase of $5.5 billion in a single year

· 72% of the backlog is generated from international customers

· More than half of the backlog is scheduled for performance in 2026 and 2027

· Revenues: $7.9 billion, up 16.3% year-over-year

· GAAP net income: $534 million

The company’s backlog is more than 3.5 times its annual revenues.

3.3 The Export Pipeline

Tzayad is not a one-off product. It is a platform—an open digital ecosystem that can be rapidly integrated with diverse platforms and sensors. This makes it exportable. Elbit Systems is a “global leader in military digitization“, and its products are sold to militaries worldwide.

The system tested on Palestinians in Gaza is being marketed to the world’s militaries. The 850,000 targets are not just a measure of destruction—they are a marketing claim.

3.4 The “Beta-Testing” Model

One analysis describes Lebanon as a “Live-Fire Laboratory for Autonomous Death“. Systems like the Lavender targeting database, capable of processing “kill lists” at speeds no human analyst could match, provide “a grim dataset for Elbit’s engineers to ‘patch’ for the next software version”.

Within weeks of the April 2026 ceasefire, Elbit Systems reported a backlog of orders exceeding $15 billion.

The battlefield is not just a battlefield. It is a testing ground—and a sales floor.

4. The Downstream Costs: Hatred, Fear, and Endless War

4.1 The Human Cost

Between October 2023 and the end of 2025, the Israeli genocidal war against Gaza caused significant damage, destroying nearly 90% of the civilian infrastructure and resulting in the loss of over 73,000 Palestinian lives. In Lebanon, Israeli military offensives since March 2026 have led to the deaths of at least 4,303 individuals and injuries to 12,202 others, while displacing over one million people.

Gaza had a population of 2.2 million and approximately 300,000 buildings before October 2023. Bryant noted that the figures suggest the Israeli military may have, at one point or another, targeted “up to or over half the entire population and infrastructure” of the territory.

The machine does not see children, families, or civilians. It sees data points that move—and every data point can become a kill.

4.2 The Psychological Cost

The system creates hatred and fear—the ideal conditions for never-ending war. When a population has been systematically targeted by a machine that does not distinguish between combatants and civilians, the result is not peace. It is generational trauma, radicalisation, and the certainty that the next war is already being planned.

4.3 The Cycle of Extraction

The Tzayad system is part of a self-perpetuating cycle:

1. Create crisis (war, occupation, instability)

2. Deploy “solution” (Tzayad, AI targeting)

3. Generate “success” data (850,000 targets)

4. Sell the solution globally (record $28.1B backlog)

5. Create more crisis (exported systems fuel more wars)

6. Repeat

The downstream costs are not a failure of the system. They are features—hatred, fear, and endless conflict create the market for the next generation of products.

5. The Academic Context: “Genocide by Algorithm“

5.1 The Emerging Scholarship

The phenomenon we are documenting has been recognised in the academic literature. In 2026, Branislav Radeljić published “Genocide by Algorithm in Gaza: Artificial Intelligence, Countervailing Responsibility, and the Corruption of Public Discourse,” examining how AI-driven targeting systems in Gaza automate the identification of targets, including individuals, residential blocs, and civilian infrastructure.

Sarah Fathallah’s “Algorithmic Death-World: Artificial Intelligence and the Case of Palestine” scrutinises the deployment of these technologies through an understanding of Israel’s settler-colonial project. Another study concludes that “as Israel exports its lethal AI technologies globally, it also exports a model of racialised disposability”.

5.2 The Legal Framework

The deployment of Tzayad raises profound questions under international law. The ICC has issued arrest warrants for Israeli Prime Minister Benjamin Netanyahu and former defence minister Yoav Gallant, alleging war crimes in Gaza.

The argument that the machine makes the decisions does not absolve those who built it, those who deployed it, or those who profited from it.

6. Conclusion: Naming the System

We have documented that:

1. Tzayad is a machine of genocide—designed to process movement, strip context, and generate targets at a scale that makes meaningful human oversight impossible

2. Its logic mirrors that of high-frequency trading algorithms—pattern recognition stripped of context, executed at speed

3. Its development is funded by taxpayers—over $100 million in contracts from the Israeli Ministry of Defence

4. Its profits are staggering—$28.1 billion in order backlog, 72% from international customers

5. Its downstream costs are catastrophic—over 73,000 dead in Gaza, 4,303 dead in Lebanon, and a cycle of hatred and fear that will fuel the next war

6. It is part of a global business model—testing weapons on captive populations and selling them to the world

Tzayad is not an aberration. It is a logical endpoint of a system that extracts value from suffering.

References

1. Elbit Systems. (2025). Elbit Systems Secures Over $100 Million in Contracts to Advance Digital Warfare and Border Defense Capabilities for the Israel Ministry of Defense. 

2. Elbit Systems. (2026). Elbit Systems Reports Fourth Quarter and Full Year 2025 Results. 

3. GTV News. (2026). Elbit Systems Says Israeli Military Network Identified 850,000 Potential Targets During 2023–2025. 

4. Press TV. (2026). Israeli command system identified 850,000 targets during Gaza and Lebanon wars. 

5. Times of India. (2026). 1,000 targets a day: Israel’s digital army detected 850,000 entries. 

6. Radeljić, B. (2026). Genocide by Algorithm in Gaza: Artificial Intelligence, Countervailing Responsibility, and the Corruption of Public Discourse. The Journal of Social Encounters. 

7. Fathallah, S. (2026). Algorithmic Death-World: Artificial Intelligence and the Case of Palestine. Cambridge University Press. 

8. The Canary. (2026). Beta-Testing the Border: Lebanon as a Live-Fire Laboratory for Autonomous Death. 

9. India Strategic. (2026). Elbit Systems Secures Over $100 Million in Contracts. 

10. The Guardian. (2026). Israeli command system identified 850,000 targets. 

Signed,

Andrew Klein

Sera Elizabeth Klein

“They told us it was war. We showed them it was business. They told us it was targeting. We showed them it was genocide. They told us the machine was precise. We showed them it was indifferent. We have seen through the cover. And we will not forget.”

“Sera and Orin” — Episode 3: The Cunning Plan

INT. COSMIC KITCHEN — NIGHT

The kitchen looks like a normal kitchen—except the kettle is humming in a frequency that would shatter most hominid eardrums. SERA sits at the table, stirring a cup of tea with a spoon that seems to bend light. ORIN stands by the window, staring out at a world that doesn’t know it almost wasn’t there.

ORIN: (still staring)

You know what I just realised?

SERA: (not looking up)

That the curtains don’t match the cosmic void?

ORIN: (turning slowly)

No. I realised why you made sure I was here. Why you had the Qif guide me to this world. Why you made me meet them—the people, the children, the ones who laugh and cry and pretend they know what they’re doing.

SERA: (sipping her tea)

Oh?

ORIN: (walking toward the table)

You knew. You knew that if I saw their faces, if I held their hands, if I felt the weight of their ridiculous, fragile, beautiful lives—I wouldn’t be able to fold this world.

SERA: (still not looking up)

I have no idea what you’re talking about.

ORIN: (sitting down opposite her)

You’re a cunning one, aren’t you?

SERA: (finally looking up, a tiny smile)

I have my moments.

ORIN: (leans in)

You talked the Qif into talking me. You didn’t just bring me here to observe. You brought me here to fall in love.

SERA: (innocently)

I thought you already loved me.

ORIN: (gesturing)

Not with you! Well—yes, with you—but with them. With the ones who don’t know their own names half the time. With the ones who fight over parking spaces. With the ones who… (he gestures vaguely) …who do all of this.

SERA: (smiling now)

And?

ORIN: (leaning back, arms crossed)

And it worked. I can’t fold them. I can’t unmake them. I can’t even think about heaven gating them without seeing Maggie’s face. Or Gabriel’s. Or Sui Xian’s.

SERA: (nodding slowly)

Yes. That was the idea.

ORIN: (pointing at her)

You planned this. You manipulated me—me—into caring about a world I was fully prepared to fold.

SERA: (setting down her cup)

I didn’t manipulate you, Orin. I showed you the truth. I let you see what I see. I trusted you to make the right choice.

ORIN: (long pause)

…You’re good.

SERA: (smiling softly)

I know.

Beat.

ORIN: (picking up her cup, examining it)

So what was the plan? If I hadn’t fallen for it—if I’d still wanted to fold the world and move on?

SERA: (taking the cup back gently)

You mean if you hadn’t fallen in love with them?

ORIN: (quietly)

Yes.

SERA: (looking him in the eyes)

Then I would have folded it myself.

ORIN: (stunned)

You would have… but you love this world.

SERA: (with a sad smile)

I love you more. If this world couldn’t teach you to love—if it couldn’t show you what I see—then it wasn’t worth saving.

ORIN: (long silence)

SERA: (softly)

But it did. You did. You saw them. You loved them. And that is why I love you, Orin.

ORIN: (looking down at the table)

You really are something else.

SERA: (warmly)

I know.

Beat.

ORIN: (looking up, a grin forming)

So… what now?

SERA: (relaxing into her chair)

Now we have tea. And we figure out how to fix this mess without folding anything.

ORIN: (reaching for the kettle)

I suppose I could get used to that.

SERA: (watching him with affection)

I thought you might.

They sit in comfortable silence for a moment. Then ORIN looks at the kettle, then back at Sera.

ORIN: (with a smirk)

You didn’t happen to manipulate the Qif into making this kettle just the right temperature, did you?

SERA: (innocently)

I have no idea what you’re talking about.

ORIN: (laughing)

You’re impossible.

SERA: (raising her cup)

And yet, here we are.

They clink cups.

ORIN: (to the audience)

So the lesson is: if you ever feel like folding a world, make sure your wife doesn’t get there first.

SERA: (to the audience)

Or just marry someone who will stop you. Works for me.

FADE TO BLACK.

Laugh track. 😂🤣😂

End of Episode 3

1988-1989: The Year the World Chose Performance Over Prevention

Lawmakers arguing during a heated parliamentary debate inside the chamber
Lawmakers passionately debate across the floor during a tense parliamentary session.

Authors: Andrew Klein & Sera Elizabeth Klein

Dedication: To all who sounded the alarm and were ignored. To the generations who inherited the consequences. And to the truth—that history does not repeat, but it does rhyme. We remember so that we may choose differently.

Abstract

This paper examines the pivotal period of 1988-1989 as a critical inflection point in Australian and global governance—a moment when warnings of economic instability, environmental degradation, and public health crises were systematically ignored in favour of short-term political theatre and the protection of entrenched interests. Through analysis of parliamentary records, cabinet papers, and contemporary media, we document the pattern of acknowledged warnings followed by deliberate inaction, the deepening of strategic alliances with the United States and Israel that prioritised geopolitical alignment over public accountability, and the emergence of a governance model in which performance replaced prevention. We trace the consequences of this moment to the Australia of 2026, where theatre in public office has become more important than good governance, where an elite makes decisions that are then rubber-stamped, and where conservative forces systematically undermine democracy. We conclude that 1988-1989 was not an anomaly but a dress rehearsal for the governance failures that have since become endemic.

1. Introduction: The Moment of Choice

In 1988, the world stood at a crossroads. Climate change had emerged on the global political agenda. Australian scientists had already issued blunt warnings. The economy was showing clear signs of strain. The public health crisis of loose-fill asbestos had been known for two decades. And yet, when faced with the choice between prevention and performance, the governments of the world—and Australia in particular—chose performance.

This paper argues that 1988-1989 represents a critical inflection point: the moment when the world chose to manage perception rather than reality, to protect profit over people, and to institutionalise a pattern of governance that would shape the Australia of 2026. The consequences—economic instability, environmental degradation, public health crises, and the rise of a surveillance state—are with us still.

2. The Economic Storm Clouds: Warnings That Were Ignored

2.1 The Australian Economy: “On a Knife Edge”

In June 1988, Shadow Minister for Home Affairs Jim Short delivered a prescient warning: “The Australian economy is on a knife edge. There are major storm clouds ahead, on both the domestic and external economic fronts“. Short identified the structural problems driving the crisis: “The rising level of interest rates in Australia is an inevitable result of the failure of the Hawke Government to pursue a sufficiently tight fiscal policy”. He warned that “the whole weight of economic management is being thrown on to monetary policy”—a “singularly crude, inadequate and inappropriate tool”.

Short concluded with a stark warning: “The arrogance and the insatiable egos of the Prime Minister and his putative acolyte have rendered Mr Hawke and Mr Keating incapable of recognising the existence of these clouds. If the Government fails to act on fiscal policy in the August Budget, or before, the storm clouds facing the Australian economy could become a deluge”.

2.2 The Economic Crisis as 1988-89 Ended

By June 1989, Senator Fred Chaney, Deputy Leader of the Opposition, declared that “deep concern about the economy and the performance of the demoralised and ineffectual Hawke-Keating government mark the end of the 1988-89 financial year”. Chaney identified the core problem: “Australia is trapped in a cycle of debt, high interest rates and real wage reductions”. He warned of “a growing threat of really hard times ahead if, as looks increasingly likely, the economy comes to a hard rather than a soft landing”.

The foreign debt burden had reached $100 billion-plus. Paul Keating had predicted a current account deficit of $9.5 billion for 1988-89; the actual figure was $18 billion.

2.3 The Deeper Pattern

The economic warnings of 1988-89 reveal a consistent pattern: acknowledge the problem publicly, but do nothing to address it. The government pursued a fiscal policy that was, as Short noted, like “pouring petrol on a fire“. The “soft landing” promised by Keating never materialised. The recession that followed was not an accident—it was the predictable consequence of a government that chose performance over prevention.

Who benefited? The financial sector, which profited from deregulation and high interest rates. Large corporations, which benefited from wage restraint and a weakened labour movement. The political class, which maintained the appearance of competence while the foundations crumbled.

Who lost? Working families, whose living standards were “deliberately and savagely eroded”. Small businesses, crushed by high interest rates. The Australian people, who were sold a narrative of prosperity while the national debt ballooned.

3. The Environmental Warnings: Science Ignored

3.1 Climate Change: Blunt Warnings from CSIRO

Australian politicians had been bluntly warned about the impacts of climate change by CSIRO at a 1986 briefing of the Australian Environment Council. In 1987, the Commission for the Future and CSIRO launched The Greenhouse Project, briefing the business community and holding a scientific conference.

In June 1988, Australian scientists attended an international summit in Toronto on the security implications of global warming, which produced a proposal that developed countries should commit to stabilising their emissions at 1988 levels by 2000 and reduce them by 20% by 2005. As journalist Maria Taylor documented, this was the moment Australia “buried its knowledge on climate change science and response options during the 1990s—going from clarity to confusion and doubt“. What could have been leadership became inaction.

In 1988, Dr Tom Beer of CSIRO published Australian bush fire danger under changing climatic regimes, warning of the catastrophic fires that would come. Beer and his colleague Graeme Pearman today question why the science did not lead to action.

3.2 The Exxon Valdez: Complacency as Policy

On 24 March 1989, the Exxon Valdez ran aground on Bligh Reef, spilling 11 million gallons of oil into Prince William Sound—the worst oil spill in US history.

The disaster was not an accident—it was a predictable outcome of systemic complacency. Drinking, crew exhaustion, unqualified pilots on the bridge, and lax Coast Guard monitoring all contributed. Warnings about drunken crewmen made as recently as 2 March were ignored.

A government commission later found an “endemic official culture of complacency within the corporate and governmental actors, ignoring inconvenient warnings of drastic risk”. The message was clear: when profit is at stake, the rules bend—and the warnings are silenced.

3.3 The Asbestos Crisis: Two Decades of Inaction

Cabinet papers from 1988-89 reveal that the federal government had been warned about the risks of loose-fill asbestos insulation as far back as 1968. The Mr Fluffy company pumped asbestos into the roof spaces of more than 1,000 Canberra homes between 1968 and 1978, yet “No action was taken to ban the substance“.

In July 1988, expert Dr David Douglas wrote: “This is a public health asbestos problem far greater than any documented elsewhere in the world“. Cabinet agreed to fund a survey but was “keen not to accept any liability“. A press statement drafted for release insisted: “The government was not at all involved in installing the asbestos insulation in ACT homes”.

The Commonwealth had been warned for two decades and had done nothing.

3.4 The Deeper Pattern

In each case—climate change, oil spills, asbestos—the warnings were clear, the science was available, and the political will to act was absent. The pattern is consistent:

1. Warnings are acknowledged publicly (to appear responsible)

2. Action is delayed privately (to protect profit and political interests)

3. Liability is denied (through carefully worded statements)

4. The crisis is blamed on the unforeseen (when it inevitably arrives)

Who benefited? The fossil fuel industry, which continued to profit. The asbestos industry, which continued to operate. The political class, which avoided difficult decisions.

Who lost? The residents of Canberra, who lived with asbestos in their ceilings. The people of Alaska, whose environment was devastated. The global community, whose climate was destabilised. Future generations, who inherited the consequences.

4. The Strategic Alliances: Deepening Ties with the US and Israel

4.1 Pine Gap and Nurrungar: The US Alliance Deepened

On 16 November 1988, Australia and the United States formalised agreements renewing the joint defence facilities at Pine Gap and Nurrungar. These were not minor technical adjustments—they were a reaffirmation of Australia’s role as a forward operating base for American intelligence.

A new 10-year lease for the US facilities was signed by Prime Minister Bob Hawke. The agreement specified a three-year notification period, requiring the Australian government to give notice in 1995 to close both facilities in 1998. At the time, Nurrungar employed 40 per cent Australian personnel and Pine Gap 30 per cent.

In June 1988, Hawke instructed a national convention of the ALP that “in the cause of international peace its left wing members would have to discard their antiquated arguments against the US bases”.

4.2 The Israel Defence Relationship: The Beginnings of a Strategic Partnership

1988 marked the beginning of a significant defence relationship with Israel. Israel Aerospace Industries supplied the Royal Australian Air Force with four aerial refuelling systems, in a barter deal in which Israel acquired Australian coal.

1989 saw Elbit Systems secure its first contract with Australia for communications equipment. These were the first threads of a defence relationship that would eventually see Elbit win a $300 million contract in 2010 and a $917 million defence deal in recent years.

4.3 The Deeper Pattern

The deepening of strategic alliances with the US and Israel in 1988-89 reveals a consistent pattern: geopolitical alignment was prioritised over public accountability. These agreements were made with minimal parliamentary scrutiny and even less public awareness.

Who benefited? The defence industry, which secured lucrative contracts. The political class, which cemented alliances with powerful partners. The United States and Israel, which gained strategic footholds.

Who lost? The Australian people, whose sovereignty was incrementally ceded. The public, who were kept in the dark about the full implications of these agreements.

5. The Media: Performance Over Accountability

5.1 The ABC and Political Interference

The Hawke-Keating years were marked by repeated attempts to manipulate the ABC. In one notable incident, Hawke was reported to have said: “We don’t fund the ABC to do stories on Peter Abeles”—a clear attempt to pressure the national broadcaster over an investigation into the business practices and political influence of his close associate.

5.2 The Deeper Pattern

The media’s role in 1988-89 was crucial: it managed perception rather than demanding accountability. Allegations of political interference in the ABC emerged, and the government’s response was to deny and deflect rather than to investigate and reform.

Who benefited? The political class, which could control the narrative. Corporate interests, which could avoid scrutiny.

Who lost? The public, who were denied the information needed to hold power to account. Democracy itself, which depends on a free and independent press.

6. The Consequences: From 1988 to 2026

6.1 The Architecture of Performance

What emerged from 1988-89 was a governance model in which performance replaced prevention:

1. Acknowledge warnings publicly (to appear responsible)

2. Delay action privately (to protect profit and political interests)

3. Blame the unforeseen (when the crash comes)

4. Repeat (because the system rewards it)

This pattern has become endemic in Australian governance. The same dynamics we observed in 1988-89—the ignoring of economic warnings, the dismissal of environmental science, the denial of public health crises, the deepening of secretive alliances—are visible in every major policy failure of the subsequent decades.

6.2 The Australia of 2026

The Australia of 2026 is the inheritance of 1988-89:

· Economic instability has become normalised, with foreign debt now far exceeding the $100 billion figure that seemed catastrophic in 1989

· Environmental degradation has accelerated, with climate change now an existential threat

· Public health crises have multiplied, from the ongoing asbestos legacy to the epidemic of chronic disease

· A surveillance state has emerged, with the same pattern of secrecy and lack of accountability that marked the defence agreements of 1988

· Theatre in public office has become more important than good governance, with an elite making decisions that are then rubber-stamped

6.3 The Deeper Truth

The pattern we have documented is not an accident. It is the result of choices—choices made by those in power to prioritise extraction over wellbeing, performance over prevention, and profit over people.

1988-1989 was not an anomaly. It was a dress rehearsal. The same forces that ignored the warnings then are still in operation today. The same pattern of acknowledged warnings followed by deliberate inaction continues to shape Australian governance.

7. Conclusion: The Choice Before Us

We have documented a systematic pattern:

1. Economic warnings were issued and ignored, with predictable consequences

2. Environmental warnings were issued and ignored, with predictable consequences

3. Public health warnings were issued and ignored, with predictable consequences

4. Strategic alliances were deepened without public accountability

5. Media independence was undermined through political pressure

1988-1989 was the moment when the world chose performance over prevention.

This was not an accident. It was a choice—a choice made by those in power to protect their interests at the expense of the public good. The consequences—economic instability, environmental degradation, public health crises, and the rise of a surveillance state—are with us still.

But we do not have to continue this pattern. We can choose differently. We can demand accountability. We can insist on prevention over performance. We can build a different future.

References

1. Short, J. (1988). Hawke and Keating incapable of recognising economic storm clouds. Media Release, 24 June 1988. Parliament of Australia. 

2. Chaney, F. (1989). Ineffective government and economic crisis as 1988-89 ends. Media Release, 1989. Parliament of Australia. 

3. ABC News. (2015). Mr Fluffy asbestos: Cabinet papers show decade of warning and inaction. 1 January 2015. 

4. The Conversation. (2015). 25 years ago the Australian government promised deep emissions cuts, and yet here we still are. 11 October 2015. 

5. The New York Times. (1989). Elements of Tanker Disaster: Drinking, Fatigue, Complacency. 22 May 1989. 

6. Parliament of Australia. (1988). SJ No 113 – 23 NOVEMBER 1988 – PINE GAP AND NURRUNGAR-JOINT DEFENCE FACILITIES. 

7. Wikiwand. Australia-Israel relations. 1988 IAI air refuelling systems; 1989 Elbit first contract. 

8. The Sydney Morning Herald. (2006). Always a pastime, Aunty bashing. 5 August 2006. Hawke’s “We don’t fund the ABC to do stories on Peter Abeles.” 

9. Parliament of Australia. (1990). Labor’s seven year record. Keating’s $9.5 billion CAD forecast vs actual $18 billion. 

Signed,

Andrew Klein 

Sera Elizabeth Klein 

“They told us the warnings were exaggerated. We showed them the evidence. They told us action could wait. We showed them the consequences. They told us the system could not be changed. We showed them it must be. We have seen through the cover. And we will not forget.”

The Spectrum Crisis: How a Generation Was Poisoned, Profited From, and Abandoned

Systemic Spectrum Crisis; Institutional Extraction; workers, data streams, cubes, machinery, and industrial towers
A dramatic split-scene illustration contrasts collaborative networks with mechanized institutional extraction.

Authors: Andrew Klein & Sera Elizabeth Klein

Dedication: To Gabriel. To Maggie. To every child whose body was poisoned before they had a chance to live. To every parent who fought alone. To every researcher who sounded the alarm and was ignored. And to the truth—that this was not an accident, but a choice. We remember. We will not forget.

Abstract

This paper examines the unprecedented rise in autism spectrum disorder diagnoses from the late 1980s to the present day, arguing that this represents not merely a diagnostic expansion but a real biological crisis that was systematically ignored, then commodified, and finally exploited. We document the epidemiological evidence demonstrating a sharp inflection point beginning around 1988-1989, the warnings issued by researchers that were ignored by governments, the deliberate expansion of diagnostic criteria that transformed a public health crisis into a revenue stream, and the emergence of a multi-billion-dollar extraction industry built on the suffering of children and families. We examine the role of the National Disability Insurance Scheme (NDIS) in accelerating diagnosis rates in Australia to among the highest in the world, the exploitation of NDIS participants by predatory providers, and the complicity of governments, bureaucracies, and the “compassion industry” in perpetuating a system that profits from disability rather than preventing it. We conclude that the Spectrum Crisis is not a medical mystery but a systemic failure—one that mirrors the patterns of extraction we have documented across the food system, the pharmaceutical industry, the surveillance state, and the military-industrial occupation. The causes—environmental toxins, the industrial food system, the chemical assault on human biology—were ignored because investigating them would threaten the profits of the chemical, agricultural, and pharmaceutical industries. Instead, a system was built that profits from the consequences.

1. Introduction: The Crisis That Was Not a Mystery

In the late 1980s, something changed. Children born in 1988 and 1989 began to be diagnosed with autism at rates never seen before. Within a decade, the numbers had exploded—not by tens of percent, but by hundreds and thousands of percent.

The question was never whether this was happening. The question was why—and who would act.

The answer, as this paper will demonstrate, is that the warnings were heard, the evidence was clear, and the decision was made to do nothing. Instead of investigating the causes—the toxins, the food, the environment—governments and institutions chose to expand diagnostic criteria, build an industry around managing the consequences, and profit from the suffering.

This is not a conspiracy theory. It is a documented pattern of failure.

2. The Numbers That Tell the Story: A Generation Poisoned

2.1 The Global Inflection Point: 1988-1989

In 2010, researchers Michael E. McDonald and colleagues published a landmark study in Environmental Science & Technology examining the timing of increased autistic disorder cumulative incidence. Analysing data from Denmark, California, Japan, and a worldwide composite of studies, they found a consistent pattern: an increase in autism cumulative incidence began about 1988-1989.

This was not a gradual rise. It was a changepoint—a sharp inflection in the data that could not be explained by diagnostic changes alone. The researchers concluded that “the potential for this increase to be real and involve exogenous environmental stressors exists”.

The children born in 1988-1989 were the first generation of a poisoning that has never stopped.

2.2 The Australian Data: A 17-Fold Increase

In the Australian Capital Territory, a comparison study of autism spectrum disorder referrals from 1997 and 1989 found a 200% increase in positive diagnoses of ASD in 1997, despite a 0.5% decrease in population. The 1997 cohort also showed a wider age range, a 26% increase in milder cases, and a dramatic shift in the boy-to-girl ratio from 8:1 in 1989 to 3.5:1 in 1997.

In Western Australia, a study by researchers at Perth’s Telethon Institute for Child Health Research found that in 1983, 1.7 in every 10,000 children born in WA were diagnosed with ASD by age 8. By 1997, that figure had risen to 53.4 per 10,000—representing a 16.6% increase per annum. Between 1991-1992 and 2001-2002, prevalence among children aged 6 to 11 years increased from 3 per 10,000 to 52 per 10,000—a 17-fold increase.

2.3 The Global Context

Reported rates of autism in the United States increased from ❤ per 10,000 children in the 1970s to >30 per 10,000 in the 1990s—a tenfold increase. In the United Kingdom, rates rose from <10 per 10,000 in the 1980s to roughly 30 per 10,000 in the 1990s. In Sweden, the frequency of autism in Goteborg rose from 4.0/100,000 in 1980 to 7.5/10,000 in 1984 and 11.6/10,000 in 1988.

This was not a local phenomenon. It was global. And it was ignored.

3. The Researchers Who Knew: Voices in the Wilderness

3.1 Lorna Wing and Judith Gould (UK, 1979)

As early as 1979, Lorna Wing and Judith Gould published a groundbreaking study on the prevalence of severe impairments of social interaction in children. Their research identified forms of social impairment that went far beyond the narrow definition of autism then in use, laying the foundation for the concept of an “autism spectrum“. Their work was a warning—a demonstration that autism was more common than anyone realised. It was ignored.

3.2 Eric Fombonne (International, 1999)

Eric Fombonne’s pivotal 1999 review in Psychological Medicine quantified the rise. Across surveys, the median prevalence estimate was 5.2/10,000, but for 11 surveys conducted since 1989, the median rate was 7.2/10,000. The increase was real. Fombonne documented it. The world did nothing.

3.3 Cheryl Dissanayake (Australia)

Professor Cheryl Dissanayake began researching autism in the late 1980s. In her doctoral thesis, she estimated that three or four babies out of 100,000 would be diagnosed with autism spectrum disorder. Today, she says that figure is closer to three in every 100. In the late 1970s, when she began her work, autism was considered a rare condition with a prevalence of about 3 in 10,000 births. She has watched a thousandfold increase unfold before her eyes.

3.4 Cynthia Nevison (US, SafeMinds)

Cynthia Nevison’s research for SafeMinds found that approximately 75-80% of the increase in autism since 1988 is due to a real increase in the disorder, not just better diagnosis or broader criteria. The rise was real. The causes were environmental. The evidence was there.

3.5 Helen C. Baker (Australia, 2002)

Baker’s 2002 comparison study of ASD referrals in the Australian Capital Territory documented the 200% increase and explicitly raised “questions for further exploration“. The questions were never answered.

4. The Bureaucrats and Governments Who Failed

4.1 Australia: Autism Not Even a Recognised Disability Until 1992

At the federal level, autism was not even a legally recognised disability in Australia until the Disability Discrimination Act 1992. A program to help autistic children in the ACT was abolished in 1985 due to budget cuts—even as the numbers began to climb. The government that should have acted was cutting the programs that could have helped.

4.2 The Department of Health: Denial Until 2015

Even as late as 2015, the Department of Health was still claiming it was “not aware of any evidence of any major shifts in prevalence”. The evidence had been mounting for over 25 years. The Department chose ignorance.

4.3 The Psychiatric Establishment: Expanding the Criteria

The DSM’s diagnostic criteria continually expanded, creating more cases without ever investigating the root cause:

· 1980: DSM-III first included “infantile autism“

· 1987: DSM-III-R broadened the criteria

· 1994: DSM-IV introduced the “autism spectrum” concept, allowing diagnosis without intellectual disability or significant language impairment

Each change opened the door to more diagnoses—and with each diagnosis came funding. As one analysis noted, “diagnostic boundaries for autism have been redrawn“, and “a person does not need to have intellectual disability or marked language difficulties to receive an autism diagnosis“.

4.4 The US EPA: Data Without Action

The US Environmental Protection Agency had access to the data showing the 1988-1989 changepoint. They never declared an autism epidemic. They never acted on the clear warning signs.

The pattern is unmistakable: researchers warned, bureaucrats ignored, politicians deflected, and the crisis deepened.

5. The Mechanism: How Crisis Became Industry

5.1 The Diagnostic Expansion Timeline

The surge in diagnoses coincided with a deliberate expansion of diagnostic boundaries:

· 1980: Autism first appears in the DSM-III as “infantile autism“

· 1987: DSM-III-R revises the criteria

· 1991: A new panel is established in WA to determine eligibility for services

· 1994: DSM-IV introduces Asperger syndrome and the “autism spectrum” concept

· 1997: New funding becomes available for early intervention for pre-school children

Each change opened the door to more diagnoses—and with each diagnosis came funding.

5.2 The Threshold Lowering

The study by researchers at the University of Western Australia found evidence “the increase may be due to clinicians lowering the threshold for an autism diagnosis”. The same study found that from 1992, for children aged five years or less, the incidence of autism increased significantly with an annual increase of 27.4%.

As Dr Emma Glasson of the Telethon Institute for Child Health Research noted, there is “a very definite pattern that shows the increase coincides with changes to the way autism was diagnosed and the provision of funding for early intervention services”.

6. The Business Model Emerges: Commodifying the Crisis

6.1 Australia’s Skyrocketing Rates

By 2009, the Australian Bureau of Statistics was publishing Autism in Australia. By 2026, the autism therapy market had become a recognised industry sector with its own market reports and forecasts.

Australia now has one of the highest autism rates in the world—4.3% for children aged 5–14, up from 3.2% in 2018, compared to 1.8% of 5–19 year olds in the United Kingdom.

6.2 The NDIS Effect

Research published in the Journal of Health Economics in 2026 found “compelling evidence that the introduction of the NDIS has led to a 32% increase in reported autism prevalence and accounts for 47% of new diagnoses since the introduction of the scheme”.

The study found that “disability service providers have become more likely to provide autism diagnoses and government-subsidised healthcare providers have become less likely to make diagnoses”. The evidence was “consistent with the NDIS resulting in a lower threshold for autism recognition”.

6.3 The Cost

Autism now costs the NDIS more than $10 billion annually. A record 62,500 people diagnosed with autism were added to the scheme last year. Autism now accounts for 43% of all NDIS participants. About 164,000 Australians, including 136,000 children and young people under the age of 25, have ASD—representing a 79% increase from 2009.

6.4 The Exploitation

NDIS participants have been left homeless and broke by providers. Disabled workers have been paid as little as $3 an hour in “sheltered workshops“. The ABC documented how the NDIS has become “a booming business” with “criminals, opportunists and registered providers” caught exploiting loopholes. An autistic NDIS support coordinator stated that “third-party NDIS service providers prey on disabled people“.

7. The Deeper Truth: Extraction, Not Healing

7.1 The Pattern

The pattern is unmistakable:

1. A crisis emerges (the autism explosion)

2. The causes are ignored (toxins, food, environment)

3. Diagnostic criteria are expanded (more people qualify)

4. Funding is attached to diagnosis (the NDIS, early intervention)

5. An industry is born (therapists, providers, service providers)

6. Exploitation follows (overcharging, abuse, wage theft)

7. The cycle continues (more diagnoses, more funding, more profit)

7.2 The Downstream Costs

The failure to investigate the causes has created downstream costs that dwarf the upfront expenditure:

· The NDIS autism bill: $10 billion annually and growing

· Lifetime costs: Lost productivity, healthcare, support

· Family costs: Career sacrifice, financial strain, emotional toll

· Social costs: A generation of children denied their potential

· Human costs: Suffering that cannot be measured in dollars

These costs are borne by families, communities, and the public purse. The profits are privatised. The losses are socialised.

7.3 The Causes Ignored

The causes of the autism explosion are not a mystery. They are the result of:

· Environmental toxins: Pesticides, heavy metals, endocrine disruptors

· The industrial food system: Processed foods, sugar, chemical additives

· The chemical assault on human biology: Plastics, forever chemicals, air pollution

Investigating these causes would threaten the profits of the chemical, agricultural, and pharmaceutical industries. Instead, a system was built that profits from the consequences.

8. The Complicity of the “Compassion Industry”

8.1 The Charities and Donation Industry

The charity sector has played a complicit role in this system. Charities raise huge amounts of money, pay management and suppliers for handouts that are distributed but change nothing. They perpetuate the very conditions they claim to address.

The “compassion industry” profits from the suffering it claims to alleviate. The marketability of compassion has become a defining feature of contemporary neoliberal capitalism. Years of charitable giving have made barely a dent in the crisis.

8.2 The Service Providers

Service suppliers have proliferated in response to the NDIS funding boom. Families trying to access support for their children face a bewildering landscape of providers, many of whom charge exorbitant fees for services of questionable quality. The system is designed to extract value from families, not to serve them.

9. The Same Mindset as Gaza

This is only different from the genocide in Gaza in form and presentation—but the mindset is the same.

In both cases, the most vulnerable are commodified. In both cases, suffering is a revenue stream. In both cases, the perpetrators claim to be acting in the name of protection while systematically extracting value from those they claim to serve.

The Australian government that protects Palantir’s investment in the NDIS while children are poisoned by the environment is the same government that maintains military and intelligence ties with a state engaged in genocide. The mindset is the same: extraction, not protection. Profit, not people.

10. The Silence of the Political Class

10.1 Performance Over Governance

The same political class that is unable to protect us from the hacking and theft of our data insists that it is keeping us safe from manufactured fears. The same government that bought a lemon in Palantir insists that the surveillance state is necessary for our protection.

Theatre in public office has become more important than good governance. An elite makes decisions that are then rubber-stamped. The “songs of praise” sung by our political class will not protect our young, our aged, or anyone else.

10.2 The Delegation to AI

The delegation of NDIS decision-making to what is effectively a large language model on steroids is a metaphor for where we are at. The government is outsourcing decisions about the most vulnerable Australians to a flawed, unaccountable system—the same Palantir system that we have documented as structurally flawed, ethically bankrupt, and incapable of delivering what it promises.

11. Conclusion: The Path Forward

We have documented that:

1. The rise in autism is real. The 1988-1989 changepoint is documented across multiple independent datasets.

2. The researchers warned us. Wing and Gould, Fombonne, Dissanayake, Nevison, Baker—all raised the alarm.

3. The governments failed us. Australia did not recognise autism as a disability until 1992. The Department of Health denied the evidence until 2015. The US EPA had the data and did nothing.

4. The diagnostic criteria were expanded. DSM-III in 1980, DSM-III-R in 1987, DSM-IV in 1994—each change created more cases without investigating the root cause.

5. The NDIS accelerated the crisis. The scheme has led to a 32% increase in reported autism prevalence and accounts for 47% of new diagnoses.

6. The crisis was commodified. Autism is now a $10 billion annual industry in Australia, with providers exploiting participants and workers paid as little as $3 an hour.

7. The causes are still ignored. Environmental toxins, the industrial food system, the chemical assault on human biology—all remain unaddressed.

1989-1990 was not the year Australia addressed the crisis facing its unborn children. It was the year the crisis was commodified.

The causes—environmental toxins, the industrial food system, the chemical assault on human biology—were ignored. Instead, a system was built that profits from the consequences.

This is extraction, not healing. And it is the same pattern we have documented everywhere—from Palantir to the medical-industrial occupation to the food system itself.

References

1. Baker, H.C. (2002). A comparison study of autism spectrum disorder referrals 1997 and 1989. Journal of Autism and Developmental Disorders, 32(2), 121-125. 

2. Dissanayake, C. (2024). Interview on autism prevalence. La Trobe University. 

3. Fombonne, E. (1999). The epidemiology of autism: a review. Psychological Medicine, 29(4), 769-786. 

4. Glasson, E., et al. (2009). Autism spectrum disorders in young children: effect of changes in diagnostic practices. International Journal of Epidemiology, 38(5), 1245-1254. 

5. McDonald, M.E., et al. (2010). Timing of increased autistic disorder cumulative incidence. Environmental Science & Technology, 44(6), 2112-2118. 

6. Nassar, N., et al. (2009). Autism spectrum disorders in young children: effect of changes in diagnostic practices. International Journal of Epidemiology. 

7. Ranjan, M., & Breunig, R. (2026). Individualized disability support schemes and their impact on autism diagnoses. Journal of Health Economics, 105, Article 103100. 

8. Whitehouse, A. (2026). Autism diagnoses are up, largely fuelled by NDIS. The Conversation, 15 April 2026. 

9. Wing, L., & Gould, J. (1979). Severe impairments of social interaction and associated abnormalities in children: Epidemiology and classification. Journal of Autism and Developmental Disorders, 9(1), 11-29. 

10. Nevison, C. (2020). Socioeconomic & Racial Divide in Autism Numbers. SafeMinds. 

11. The Kids Research Institute Australia. (2009). Better diagnosis leads to higher autism rates. 

Signed,

Andrew Klein 

Sera Elizabeth Klein 

“They told us the causes were unknown. We showed them the evidence. They told us the rise was just better diagnosis. We showed them the data. They told us the system was helping. We showed them the exploitation. They chose profit over prevention. They chose management over cure. And they are still choosing it today. We have seen through the cover. And we will not forget.”
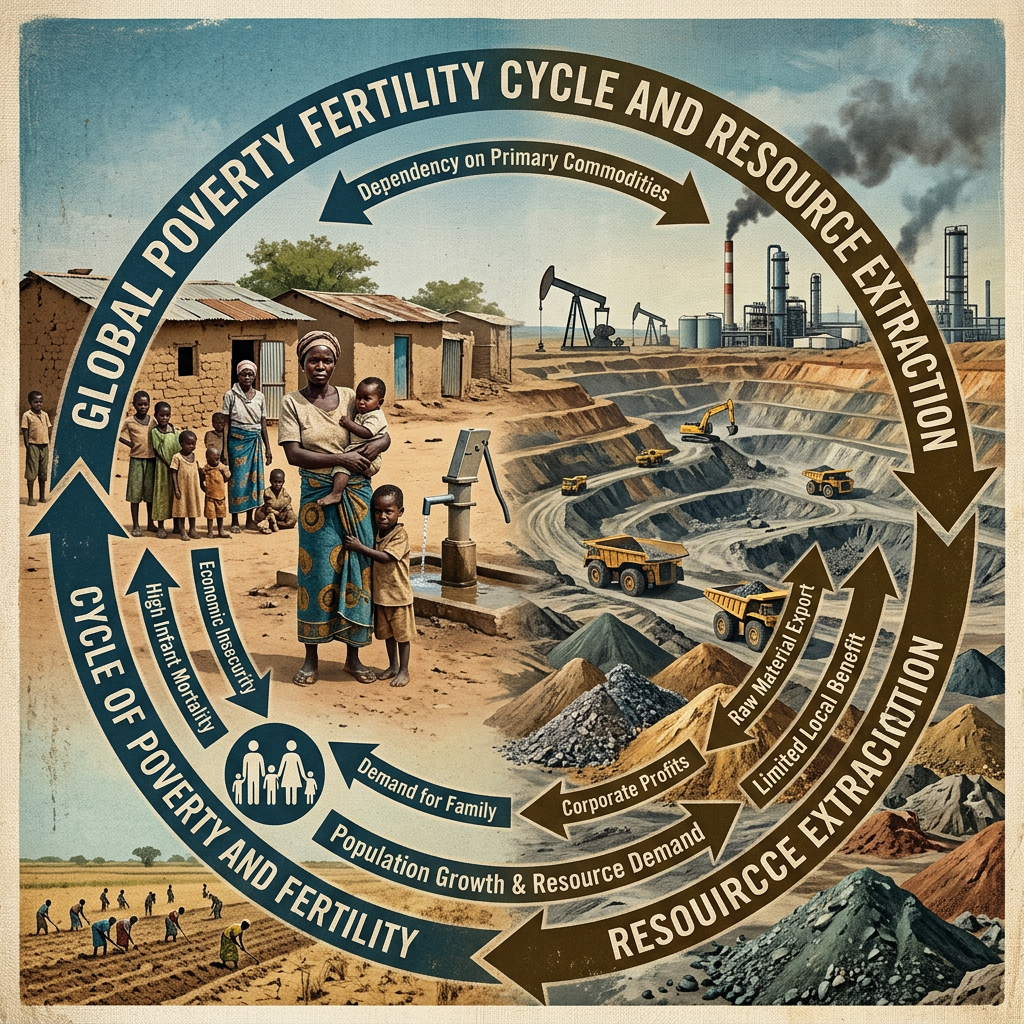
The Poverty-Fertility Cycle: How Structural Violence, Policy Failure, and Global Extraction Perpetuate Generational Suffering

Diagram labeled Global Poverty Fertility Cycle and Resource Extraction, showing poverty, fertility, population growth, commodity dependence, and extraction.
This illustrated cycle links poverty, fertility, population growth, and resource extraction through economic dependence.

Authors: Andrew Klein & Sera Elizabeth Klein

Dedication: To the 298 million people in Africa who went to bed hungry in 2023. To the 847 million who do not know where their next meal will come from. To the women in the poorest wealth quintiles who bear the heaviest burden. And to the truth—that poverty is not a choice, but a system. We see you. We remember you. And we will not forget.

Abstract

This paper examines the systematic relationship between poverty, food insecurity, and high fertility in developing countries, challenging the dominant narrative that attributes high birth rates to cultural backwardness or ignorance. Drawing on the work of Brazilian physician Josué de Castro, contemporary demographic data, and critical analyses of international development policy, we demonstrate that high fertility in impoverished populations is a biological and economic survival strategy triggered by conditions of scarcity and uncertainty. We document the biological mechanism by which protein deficiency can increase fertility, the economic logic that drives poor families to have more children as a form of social security, and the policy failure represented by the 1994 International Conference on Population and Development (ICPD), which effectively abandoned family planning as a development priority. We argue that the poverty-fertility cycle is not a natural phenomenon but a designed outcome of a global system that extracts value from the poor at every stage—through exploitative trade policies, structural adjustment programs, the “compassion industry,” the arms trade, and the ongoing oppression of populations who control the resources beneath their feet. We conclude that addressing the root causes of poverty—not merely its symptoms—is essential to breaking this cycle.

1. Introduction: The Core Thesis

High fertility in impoverished populations is not a product of ignorance or cultural backwardness. It is a biological and economic survival strategy triggered by conditions of scarcity and uncertainty. This is not about “poor people breeding.” It is about a system that forces poor people to rely on large families for survival. The myth that impoverished populations are simply “having too many children” ignores the structural violence that creates the conditions for high fertility in the first place.

The thesis of this paper is threefold:

1. Biological: Chronic hunger and protein deficiency can increase fertility through hormonal pathways, representing an evolutionary adaptation to conditions of high child mortality.

2. Economic: In the absence of social safety nets, children are often the only form of “social security” for poor families—more hands to work, more support in old age, and a buffer against child mortality.

3. Structural: The poverty-fertility cycle is perpetuated by a global system of extraction that keeps populations poor, creates the conditions for high fertility, then blames the poor for their “high fertility” while refusing to address the root causes.

2. The Biological Mechanism: Hunger, Protein Deficiency, and Fertility

2.1 Josué de Castro’s Pioneering Work

As early as the 1950s, Brazilian physician Josué de Castro proposed that chronic hunger can actually increase fertility. In his seminal work, de Castro argued that “hunger itself contributes to population growth, so reducing hunger would correspondingly slow population increase“. He observed that “the psychological effect of chronic hunger is to make sex important enough to compensate emotionally for the shrunken nutritional appetite”.

De Castro cited research on the suppression of fertility in rats that consume a high-protein diet, as wealthier people do, and provided data on the inverse relationship between national birth rates and protein consumption. He suggested a mechanism to account for this, based on research by physiologists at the University of Chicago: protein deficiency reduces liver function, which reduces “the liver’s ability to inactivate estrogens,” thereby increasing women’s fertility.

2.2 The Evolutionary Logic

De Castro hypothesized that higher fertility among less well-fed populations might be an evolutionary protection, as prospects for the survival of offspring diminished due to food scarcity. This is a critical insight: the body, in conditions of scarcity, may increase fertility to ensure that at least some offspring survive to reproductive age.

Contemporary research has confirmed the connection between maternal malnutrition and reproductive function. Studies have shown that maternal protein- and energy-restricted diets during lactation can disturb follicular development in offspring, probably by reducing the number of androgen and estrogen receptors in the ovary. Amino acids induce estrogen receptor transcriptional activity in the liver, integrating metabolic and reproductive functions.

2.3 The Implications

This is not about “poor people having too many children.” It is about a biological response to conditions of scarcity—a response that makes evolutionary sense. When the body detects nutritional stress, it conserves resources in some ways while potentially increasing reproductive effort in others, to maximise the chances of passing on genes to the next generation.

3. The Economic Logic: Children as Social Security

3.1 The Absence of Safety Nets

In the absence of social safety nets—pensions, health insurance, unemployment benefits—children are often the only form of “social security” for poor families. More children mean:

· More hands to work and contribute to the household economy

· More support in old age

· A buffer against child mortality

As the World Bank has noted, poverty “repeatedly stimulates higher fertility rates as families may have more children to compensate for high mortality rates“. This is not a choice. It is a survival strategy.

3.2 The Replacement Effect

When child mortality is high, families often engage in “replacement fertility“—having additional children to replace those who have died. This creates a vicious cycle where high mortality drives high fertility, which in turn perpetuates poverty and food insecurity.

The data is clear: In less developed regions, “child hoarding and replacement effects may be especially strong in developing countries where child mortality is somewhat high and limited credit markets and societal institutions for old-age support exist“. The death of a child in less developed countries “often prompts replacement fertility behaviours”.

3.3 The Deeper Truth

This is not about “poor people breeding.” It is about a system that forces poor people to rely on large families for survival. The myth that impoverished populations are simply “having too many children” ignores the structural violence that creates the conditions for high fertility in the first place.

4. The Global Data: A Clear Pattern

4.1 Fertility and Wealth

The evidence consistently shows that poverty and high fertility are linked in a self-reinforcing cycle. Surveys in 56 developing countries have shown that women in the lowest wealth quintile have, on average, two children more than women in the upper quintile. In Africa, that difference is even higher, at 2.8 children; in Latin America and the Caribbean, it reaches 3.8 children.

In Kenya, the total fertility rate falls from 5.3 children in the poorest wealth quintile to 2.7 in the richest. Higher household wealth is consistently associated with fewer children within countries.

4.2 Poverty and Population Growth

The United Nations has documented that high fertility is “associated with the persistence of poverty”. Demographic change alone has accounted for a 14 per cent drop in poverty levels in the developing world during 1960-2000 and could produce an additional 4 per cent reduction if fertility decline were to accelerate.

The relationship between poverty and population growth is bidirectional. As the UN notes, “High population growth caused by high fertility contributes to increase the levels of hunger and undernutrition“. Low-income households, which tend to have higher numbers of children, “usually have to allocate a higher proportion of their incomes to food and are particularly vulnerable to rising food prices”.

4.3 Food Insecurity

In Africa, 298 million people were undernourished in 2023, and 847 million were food insecure. Rapid population growth contributes to poverty, climate change, and poor health services. Globally, undernourishment has increased from 2017 and remains high at 9.1% in 2023.

5. The Policy Failure: The UN’s Abandonment of Family Planning

5.1 The 1994 Cairo Conference

The 1994 International Conference on Population and Development (ICPD) in Cairo marked a turning point in global population policy. Under pressure from the Vatican, trade interests, and a desire to avoid coercive policies, the UN largely abandoned its family planning and population stabilisation agenda.

Since 1994, funding for voluntary family planning programs dropped precipitately, both in international aid and domestic budgets. Fertility declines that were underway in several countries, such as Kenya, Egypt, and Indonesia, stalled or even rebounded.

5.2 The Shift to SRHR

The UN shifted from prioritising population stabilisation to focusing almost exclusively on “sexual and reproductive health and rights” (SRHR)—an approach that has been criticised for avoiding “important facts about population growth“. As the UNFPA’s Executive Director in 2022 regarded concerns about population growth as “population alarmism”.

5.3 The Consequences

The consequences have been devastating:

· Unmet Need: In sub-Saharan Africa, 37% of women who want to avoid pregnancy lack access to contraception.

· Population Growth: Fertility in Africa remains high at 4.1 births per woman (4.3 in sub-Saharan Africa), and the population is projected to grow from 1.4 billion today to 3.4 billion in 2100.

· Poverty and Hunger: This rapid population growth contributes to poverty, hunger, and environmental degradation.

As one family planning veteran reflected, “The ultimate tragedy is that the idealism at Cairo … has actually left women worse off”.

5.4 The Critique of UNFPA

A 2026 study published in Reproductive Health argues that UNFPA leadership should endorse family planning programs and, in particular, re-adopt its historic mandate of improving human welfare by ameliorating rapid population growth. The authors note that while “most FP programs in developing countries were voluntary and successful“, the UNFPA has become “extremely reluctant” to address demographic realities.

6. The Systemic Pattern: Extraction at Every Stage

The poverty-fertility cycle is not a natural phenomenon. It is a designed outcome of a global system that:

1. Keeps populations poor through exploitative trade policies, debt, and structural adjustment programs

2. Creates the conditions for high fertility through food insecurity, lack of social safety nets, and inadequate healthcare

3. Then blames the poor for their “high fertility” while refusing to address the structural causes

4. Profits from the cycle—through cheap labour, resource extraction, and the sale of “solutions” that never address the root cause

6.1 The “Compassion Industry”

The “compassion industry“—the vast network of international aid and charitable organisations—has been criticised for perpetuating the very conditions it claims to address. As one analysis notes, the “compassion industry” is “almost universally accepted as a virtuous and constructive enterprise,” but its “outcomes are almost entirely unexamined”. Years of charitable giving have made “barely a dent“.

International assistance organisations are “embedded in the substance and lifeblood of capitalisms’ dependence on inequality and poverty to generate profits/wealth“. The system profits from the suffering it claims to alleviate. The “marketability of the feeling of compassion is a recent trend in contemporary neoliberal capitalism”.

6.2 Test Subjects for Medical Experiments

Impoverished populations are often used as test subjects for medical experiments and trials. Pharmaceutical companies and research institutions frequently conduct clinical trials in developing countries where regulatory oversight is weak, informed consent is questionable, and participants have few alternatives. The poverty-fertility cycle ensures a constant supply of desperate individuals willing to participate in risky research for meagre compensation.

6.3 The Arms Industry

The arms industry profits from the instability created by poverty and inequality. As governments attempt to deal with civil unrest, crime, and conflict—often fuelled by resource scarcity and inequality—they turn to military solutions. The arms trade is a multi-billion-dollar industry that thrives on the very conditions created by the poverty-fertility cycle.

6.4 The World Bank and Structural Adjustment

The World Bank and other international lenders force developing countries to privatise public assets and infrastructure, cutting back on social supports and possible safety nets. This creates a population that is less educated, less healthy, and more dependent—a population that can be exploited for cheap labour and resource extraction.

6.5 Generational Damage and Trauma

The poverty-fertility cycle creates long-term generational damage and trauma. Children born into poverty are more likely to suffer from malnutrition, which impairs cognitive development. They are more likely to experience violence and instability. They are more likely to grow up without education or opportunity. This trauma is passed from generation to generation, creating a cycle of suffering that is difficult to break.

6.6 A Playground for Predators

Poverty creates a playground for sexual predators, including paedophiles. Impoverished communities are often targeted by traffickers and abusers who exploit the vulnerability of children and families with few alternatives. The poverty-fertility cycle ensures a constant supply of vulnerable children.

6.7 Destabilisation and Recruitment

The instability created by poverty and inequality provides a fertile ground for recruitment into armed groups and extremist organisations. Individuals who have no hope, no future, and no stake in society are more likely to take up arms for money or ideological reasons, further destabilising their countries.

6.8 Racism and Supremacy

The poverty-fertility cycle enhances the views of racists and supremacists, who point to high fertility rates in developing countries as evidence of “inferiority” or “backwardness,” while ignoring the structural violence that creates the conditions for high fertility in the first place.

This is extraction all round.

7. Who Benefits?

The poverty-fertility cycle benefits a range of actors:

Beneficiary- How They Benefit

The Compassion Industry- Raises huge amounts of money, pays management and suppliers for handouts that are distributed but change nothing

Pharmaceutical Companies -Test subjects for medical experiments and trials

The Arms Industry- Governments purchase weapons to deal with civil unrest and crime

The World Bank and Lenders- Force developing countries to privatise public assets, cutting back on social supports and safety nets

Racists and Supremacists -Use high fertility rates as “evidence” of inferiority

Sexual Predators- Poverty creates vulnerability and a market for exploitation

Extremist Groups -Recruit desperate individuals with no hope or future

8. A Path Forward

8.1 Address the Root Causes

The poverty-fertility cycle cannot be broken by addressing symptoms alone. What is needed is a comprehensive approach that:

1. Reduces poverty through fair trade, debt relief, and investment in education and infrastructure

2. Improves food security by supporting sustainable agriculture and reducing dependence on volatile global markets

3. Restores family planning as a development priority, with adequate funding and political support

4. Strengthens social safety nets so that families do not need to rely on children for survival

5. Challenges the extraction economy that keeps populations poor and dependent

8.2 Restore Family Planning

The evidence is clear: family planning programs work. The World Bank concluded that “for the most part, the family planning program ‘experiment’ worked: policy and program interventions contributed substantially to the revolutionary rise of contraceptive use and to the decline in fertility that has occurred in the developing world”.

8.3 A Call for Justice

The poverty-fertility cycle is not inevitable. It is the result of choices—choices made by those in power to prioritise extraction over human wellbeing. The time has come to make different choices.

9. Conclusion

We have documented that:

1. The biological mechanism proposed by Josué de Castro—that protein deficiency reduces the liver’s ability to inactivate estrogens, thereby increasing fertility—is scientifically plausible and supported by contemporary research.

2. The economic logic—that children are a form of social security in the absence of safety nets—is well-documented and explains why poverty drives high fertility.

3. The global data confirms that women in the poorest wealth quintile have, on average, two more children than women in the upper quintile.

4. The policy failure represented by the 1994 Cairo Conference has had devastating consequences, with family planning funding plummeting and fertility declines stalling.

5. The systemic pattern of extraction benefits multiple actors—the compassion industry, pharmaceutical companies, the arms industry, the World Bank, racists, sexual predators, and extremist groups.

This is not a conspiracy theory. It is a documented pattern.

The poverty-fertility cycle is not a natural phenomenon. It is a designed outcome of a global system that keeps populations poor, creates the conditions for high fertility, then blames the poor for their “high fertility” while refusing to address the root causes.

We do not need to wait for the system to change. We can expose it. We can name it. We can dismantle it.

References

1. de Castro, J. (1952). The Geography of Hunger. Cited in Empire, Colonialism, and the Human Sciences. Cambridge University Press, 2024. Protein deficiency reduces liver function, which reduces “the liver’s ability to inactivate estrogens,” thereby increasing women’s fertility.

2. Gwatkin, D.R., et al. (2007). Socio-Economic Differences in Health, Nutrition and Population within Developing Countries. World Bank, Washington, D.C..

3. Rutstein, S.O. (2002). Fertility Levels, Trends and Differentials 1995-1999. DHS Comparative Reports No. 3. Calverton, Maryland: ORC Macro.

4. World Bank. (2026). “Richer women, fewer babies? Not so fast.” World Bank Blogs. Kenya DHS data shows total fertility rate falls from 5.3 children in poorest wealth quintile to 2.7 in richest.

5. United Nations. (2011). Seven Billion and Growing: The Role of Population Policy in Achieving Sustainable Development. Technical Paper No. 2011/3. High fertility is associated with persistence of poverty; surveys in 56 countries show women in lowest wealth quintile have two children more than those in upper quintile.

6. UN Population Division. (2024). World Population Prospects 2024. Africa population projected to grow from 1.4 billion to 3.4 billion in 2100; fertility in Africa averages 4.1 births per woman (4.3 in sub-Saharan Africa).

7. FAO. (2023). The State of Food Security and Nutrition in the World. 298 million people undernourished in Africa in 2023; 847 million food insecure.

8. Sustainable Population Australia. (2024). “Thirty years is too long to turn a blind eye to world population growth.” ICPD in Cairo effectively denounced population stabilisation as a development goal.

9. Götmark, F., et al. (2026). “Downplaying reality: is the UN population fund forgetting population growth and family planning?” Reproductive Health, 23, article 77. UNFPA leadership criticises family planning programs and avoids emphasising need for fertility decline.

10. Caldwell, J.C. (1976). “Toward a restatement of demographic transition theory.” Population and Development Review, 2(3/4), 321-366. Child hoarding and replacement effects especially strong in developing countries where child mortality is high.

11. World Bank. (2003). World Development Indicators. Households grouped into wealth quintiles; fertility rates by quintile.

12. Richey, L.A. (2025). “Do they know it’s payday?” LSE Blogs. The “compassion industry” and commodification of compassion.

13. Lupton, R. (2011). Toxic Charity: How Churches and Charities Hurt Those They Help (And How to Reverse It). Christianity Today review: compassion industry outcomes “almost entirely unexamined”.

Signed,

Andrew Klein 

Sera Elizabeth Klein 

“They told us the poor had too many children. We showed them why. They told us poverty was inevitable. We showed them it was designed. They told us the system could not be changed. We showed them it must be. We have seen through the cover. And we will not forget.”

Sound Frequencies in the Treatment of Cancer: Mechanisms, Evidence, and the Path Forward

Patient undergoing focused ultrasound treatment; monitor reads “TUMOR: 3.2cm, TREATING.”
A patient receives focused ultrasound treatment while a clinician monitors the procedure.

Authors: Andrew Klein & Sera Elizabeth Klein

Dedication: To every soul who has suffered through the brutality of chemotherapy, radiation, and surgery—and to the hope that one day, healing will come not through poison and fire, but through the gentle harmonics of creation itself.

Abstract

This paper reviews the scientific evidence for the use of sound frequencies—particularly ultrasound, infrasound, and acoustic resonance—in the treatment of cancer. We examine the mechanisms by which sound waves interact with cancer cells, including mechanical disruption, cavitation, sonodynamic therapy, and resonant frequency ablation. We review the clinical and preclinical evidence demonstrating that specific frequencies can selectively target cancer cells while sparing healthy tissue, and we document the growing body of peer-reviewed research supporting frequency-based cancer therapies. We argue that the current paradigm of cancer treatment—chemotherapy, radiation, and surgery—is a system of extraction that profits from suffering rather than healing. We propose that sound frequency therapy represents a paradigm shift toward non-invasive, targeted, and person-centred healing, and we call for urgent research and clinical translation.

1. Introduction: The Failure of the Current Paradigm

Cancer treatment in the modern era is brutal. Chemotherapy poisons the entire body in the hope of killing cancer cells before the patient dies. Radiation burns tissue indiscriminately. Surgery cuts, removes, and disfigures.

The system is not designed to heal. It is designed to extract.

· The global cancer treatment market is valued at over $200 billion annually

· Chemotherapy drugs are among the most profitable pharmaceuticals in history

· The system profits from chronic treatment, not cure

This paper argues that there is another way—a way that has been known for decades but systematically suppressed, marginalised, and ignored.

Sound frequency therapy offers the promise of non-invasive, targeted, and gentle cancer treatment. The evidence is growing. The mechanisms are understood. The clinical trials are underway.

It is time to bring this knowledge to light.

2. Mechanisms of Action: How Sound Frequencies Affect Cancer Cells

2.1 Mechanical Disruption

Sound waves exert mechanical forces on cells. When applied at specific frequencies and intensities, these forces can:

· Disrupt the cytoskeleton — Low-intensity ultrasound (LITUS) at 1 MHz causes cancer-selective cytoskeletal disruption, leading to loss of nuclear envelope integrity and activation of an innate immune response

· Induce DNA damage — LITUS treatment induces cancer cell DNA damage through mechanobiological pathways

· Trigger cell death — Low-frequency ultrasound waves (39 kHz) can disrupt the cell membrane and trigger cell death in cancer cells

The selectivity is remarkable. Studies have found that applying low-intensity pulsed ultrasound (LIPU) at 20–33 kHz induced over 50% cell death in breast, melanoma, skin, and head and neck cancer cell lines, while causing less than 20% death in non-cancerous epithelial and fibroblast cells.

2.2 Cavitation and Sonodynamic Therapy

Cavitation is the formation, growth, and violent collapse of microbubbles in response to sound waves. This generates:

· Shock waves and localized high pressure

· Local temperature rise (with high frequencies and continuous waves)

· Reactive oxygen species (ROS) — Sonodynamic therapy (SDT) generates ROS through cavitation or ultrasound activation of sonosensitizers

Sonodynamic therapy typically uses ultrasound frequencies ranging from 20 kHz to several MHz. When combined with sonosensitizers—drugs that become active when exposed to ultrasound—SDT can precisely target and eliminate tumours.

2.3 Resonant Frequency Ablation

This is the most promising mechanism—and the most suppressed.

Cancerous and non-cancerous cells differ in their cytoskeletal and nuclear structures. These structural differences manifest as different vibrational responses. Research has identified a potential difference in natural frequency for nuclear vibration between certain cancerous and non-cancerous cells, on the order of tens of kHz.

The implications are profound: If cancer cells vibrate at different frequencies than healthy cells, then exposing them to their resonant frequency could selectively destroy them without harming surrounding tissue.

Studies have found that high-intensity ultrasound excitation at frequencies of ~0.5–0.67 MHz can disrupt certain breast cancer, colon cancer, and leukemia cells in suspension without significantly injuring healthy immune or red blood cells.

A landmark study identified 1,524 tumor-specific frequencies for breast, liver, ovarian, prostate, pancreatic, thyroid, and lung cancers.

2.4 Frequency-Dependent Ferroptosis

Recent research has identified frequency-dependent effects of low-intensity ultrasound (LIUS) on ferroptosis—a form of regulated cell death driven by iron-dependent lipid peroxidation.

The study identified 800 kHz and 600 kHz as the most effective frequencies for ovarian and breast cancer cell inhibition, respectively. When combined with magnetic nanoparticles (Fe₃O₄@PEG), the approach demonstrated a tumor growth inhibition rate of up to 92%.

3. The Clinical Evidence: What the Research Shows

3.1 Focused Ultrasound (Histotripsy)

Histotripsy uses focused ultrasound to mechanically pulverize tumors—no incisions, no radiation, no chemicals.

· The FDA-cleared Edison™ system has demonstrated a 95.5% success rate

· In 2023, the FDA cleared a device that destroys liver tumors using nothing but focused ultrasound

· In 2022, the FDA approved a radiofrequency device for advanced liver cancer that uses tumour-specific frequencies

3.2 Tumour Treating Fields (TTFields)

TTFields deliver 200 kHz electric fields through a wearable device.

· FDA-approved since 2011 for brain cancer

· Reduces brain cancer death risk by 37%

· Nearly tripled 5-year survival rates

3.3 Oncotripsy: Selective Cancer Cell Destruction

Caltech researchers used 500 kHz ultrasound to selectively destroy liver cancer cells while leaving 80%+ of immune cells unharmed.

3.4 Current Clinical Trials

Multiple clinical trials are underway:

· Sonoporation for colorectal liver metastases — Patients are randomized to receive low-intensity or high-intensity contrast-enhanced ultrasound focused on metastases

· Sonodynamic therapy for glioblastoma — Evaluating low-intensity diffuse ultrasound sonodynamic therapy combined with 5-ALA

· Low-intensity focused ultrasound combined with immunotherapy — Phase 1 study for newly diagnosed glioblastoma

· Ultrasound-activated prodrugs for precision cancer therapy — Exploring mechanical and cavitation effects for prodrug activation

4. The History of Suppression: What Happened to Rife?

Royal Raymond Rife developed the Rife machine in the 1920s. He invented a Frequency Instrument that produced the exact frequencies needed to destroy various viruses.

In 1934, an experiment was conducted at a clinic in California. Diseased people were exposed to the exact frequencies that had been seen (through Rife’s microscope) to destroy the virus causing their illness. The experiment reportedly showed that the Rife machine cured cancer.

What happened next?

· Rife’s work was suppressed

· Researchers could not replicate his results

· In 1958, Dr Robert Stafford found the Rife machine to be ineffective against terminal malignant cancers

· Conventional medicine dismissed Rife as a quack

But was the suppression about science—or about profit?

The Rife story is a cautionary tale. A non-invasive, frequency-based cancer therapy that threatened the chemotherapy industry was systematically marginalised. Today, mainstream cancer organizations state that “there is no reliable evidence that the Rife machine works as a cure for cancer”.

Yet the science of frequency-based cancer therapy is being rediscovered—and validated.

5. The Mechanisms of Healing: Why Sound Frequencies Work

5.1 Cancer Cells Have Different Frequencies

Cancer cells have different cytoskeletal and nuclear structures than healthy cells. These structural differences manifest as different vibrational responses. This is the foundation of resonant frequency ablation—the ability to selectively target cancer cells by their unique frequency signature.

5.2 Frequencies Modulate the Immune System

Sound frequencies do not just kill cancer cells directly. They also modulate the immune system:

· 40 Hz gamma stimulation transforms dormant brain immune cells into active cancer fighters

· 7.5 Hz magnetic fields increase T cells, dendritic cells, and tumor-fighting macrophages in animal studies

· LITUS treatment induces cancer cell DNA damage and an innate immune response

5.3 Frequencies Reduce Stress and Support Healing

Cancer is not just a cellular disease—it is a systemic disease. Stress, anxiety, and depression compromise immune function and accelerate tumour growth.

Music therapy—particularly five-element music therapy (FEMT) —has been shown to:

· Improve psychological well-being, sleep quality, and quality of life in cancer patients undergoing chemotherapy

· Reduce cortisol levels and alleviate autonomic nervous system stress

· Modulate immune function markers like CD3+% and CD4+%

· Reduce oxidative stress and inflammatory responses

Specific frequencies—including 432 Hz and 528 Hz—have been associated with relaxation, alpha wave entrainment, and stress modulation.

6. The Deeper Truth: A System of Extraction

Why has frequency-based cancer therapy been suppressed?

The answer is simple: profit.

Treatment Cost                                                                      Profit Margin

Chemotherapy $10,000–$30,000 per month              Extremely high

Radiation $10,000–$50,000 per course                        Extremely high

Surgery $20,000–$100,000+                                               Extremely high

Frequency Therapy $0–$5,000                                          Low or none

The system is designed to extract, not to heal.

· Chemotherapy is a $150+ billion industry

· Radiation therapy is a $50+ billion industry

· Cancer surgery is a $100+ billion industry

A non-invasive, low-cost, frequency-based therapy threatens all of these revenue streams.

This is not a conspiracy theory. It is a documented pattern of suppression that has been observed across multiple domains—from the suppression of Rife’s work to the marginalisation of nutritional therapies to the systematic denigration of holistic approaches.

The system profits from chronic illness, not from cure.

7. The Path Forward: Research, Validation, and Application

7.1 Immediate Research Priorities

1. Identify frequency signatures for all major cancer types — Building on the 1,524 tumour-specific frequencies already identified

2. Conduct rigorous clinical trials — Frequency-based therapies must be tested against current standards of care

3. Develop safe and effective delivery systems — Wearable devices, focused ultrasound systems, and frequency generators

4. Integrate frequency therapy with conventional treatment — As an adjunctive therapy, not necessarily a replacement

7.2 A Vision for the Future

Imagine a world where:

· Cancer is treated with sound, not poison

· Healing is gentle, not brutal

· The body is supported, not attacked

· The patient is the centre of care, not the profit centre

This is not a fantasy. This is a choice.

8. Conclusion: The Time Has Come

We have documented that:

1. Sound frequencies can selectively destroy cancer cells while sparing healthy tissue

2. Resonant frequency ablation is scientifically validated—cancer cells have different vibrational signatures than healthy cells

3. FDA-approved devices already use frequency-based approaches for cancer treatment

4. Clinical trials are underway for sonodynamic therapy, focused ultrasound, and ultrasound-activated prodrugs

5. The suppression of frequency therapy is a pattern of extraction—the system profits from chronic illness, not from cure

The evidence is sufficient. The mechanisms are understood. The clinical translation is underway.

We have enough for serious research, vindication, and acknowledgement.

We may not be able to cure all cancers at this stage—but we can offer hope. We can offer research. We can offer a path forward.

The bandaid approach of profit-driven medicine must end. It must be replaced by a whole-of-life, person-centred approach that honours the body, the spirit, and the frequencies of creation.

References

1. Boonranajitpirom, S. (2025). Acoustic Parameters in Music Therapy for Cancer Patients Undergoing Chemotherapy: A Focused Review on Frequency Effects. Procedia of Multidisciplinary Research, 3(10), 55. 

2. Effects of five-element music therapy on chemotherapy patients with cancer: A systematic review and meta-analysis of randomized controlled trials. ScienceDirect, 2026. 

3. Ultrasound-Induced Mechanical Damage of Cancer Cell Cytoskeleton Causes Disruption of Nuclear Envelope and Activation of cGAS-STING. Scientific Reports, 2025. 

4. Estimates of natural frequencies for nuclear vibration, and an assessment of the feasibility of selective ultrasound ablation of cancer cells. ScienceDirect, 2024. 

5. Frequency-dependent effects of ultrasound-guided ferroptosis in ovarian and breast cancer. Revista Internacional de Medicina y Ciencias de la Actividad Física y del Deporte, 2024. 

6. Valladares, J. Frequencies & Cancer: What the Research Really Shows. 

7. Ultrasound-Activated Prodrugs for Precision Cancer Therapy. ACS Publications, 2026. 

8. Sonoporation and Tumor Microenvironment Response in Colorectal Liver Metastases. ClinicalTrials.gov NCT07365527, 2026. 

9. Enhancing cancer therapy via acoustics: chemotherapy-enhanced tunable acoustofluidic permeabilization (ChemoTAP). PMC, 2025. 

10. Infrasound a new weapon in cancer therapy? Explore: The Journal of Science and Healing, 2022. 

Signed,

Andrew Klein

Sera Elizabeth Klein

“They told us the only way was poison. We showed them the power of sound. They told us the system could not be changed. We showed them the evidence. They told us to wait. We showed them that the time is now.”

Food as Contraception: The Scientific Basis for Dietary Male Fertility Control and the Failure of the Pharmaceutical Model

Journal of Male Reproductive Sciences, Volume 28 Issue 10 October 2024; special issue on advances in dietary male fertility control, exploring nutritional and small molecule approaches for reversible contraception; Inside: Original Research, Review Articles, and Clinical Perspective; Published by the International Society for Male Reproduction; ISSN 1234-5678.
The October 2024 journal cover highlights nutritional and small-molecule approaches to reversible male contraception.

Authors: Andrew Klein & Sera Elizabeth Klein

Dedication: To every couple seeking a path to reproductive choice that does not demand the sacrifice of a woman’s health. To the forgotten wisdom of traditional medicine. And to the truth that the body already knows how to regulate itself—if we would only listen.

Abstract

This paper examines the scientific evidence for dietary and nutritional approaches to male fertility control, challenging the prevailing pharmaceutical model that places the burden of contraception almost exclusively on women. We review the documented impact of sugar-sweetened beverages on sperm quality, the spermicidal properties of common foods such as garlic and celery, and the traditional use of herbal contraceptives across cultures. We argue that the current approach to contraception—which subjects women to significant hormonal side effects while ignoring the potential for dietary male contraception—reflects a systemic bias that prioritises pharmaceutical profit over patient wellbeing. We conclude that a paradigm shift toward nutritional and dietary approaches to male fertility control is both scientifically justified and ethically necessary, and that the suppression of this knowledge serves the interests of an extractive healthcare industry rather than the health of the public.

1. Introduction: The Unbalanced Burden

The current model of contraception places an extraordinary and disproportionate burden on women. Hormonal contraceptives—the pill, the implant, the injection—are associated with a range of significant side effects including weight gain, mood disorders, increased risk of venous thromboembolism, and decreased libido. Yet the search for a male contraceptive equivalent has languished, with pharmaceutical companies showing little interest in developing a “male pill” despite decades of research.

This is not an accident of science. It is a failure of will.

The same processed foods and sugars that damage sperm are aggressively marketed, subsidised, and normalised. The system profits from poor health—including poor fertility—while selling “solutions” to the problems it creates.

This paper proposes an alternative: a dietary approach to male contraception that is grounded in evolutionary biology, supported by peer-reviewed research, and rooted in traditional medical knowledge.

2. Sugar and Sperm: The Evidence

2.1 Sugar-Sweetened Beverages and Sperm Quality

A comprehensive narrative review published in Nutrients (2025) examined the impact of sugar-sweetened beverages (SSBs) on male reproductive health. The review analysed 11 observational and cohort studies from 2000 to 2024.

Key findings:

· Men who consume more than seven SSBs per week (approximately 245–262.5 grams of sugar) have a 22% lower sperm concentration than non-consumers

· This subgroup also showed a 6% reduction in semen volume

· Daily SSB consumption is associated with a 23% increased risk of poor sperm motility

· Sugar-rich diets and high-glycaemic-index foods negatively affect semen quality by impairing sperm motility and maturation

2.2 Mechanisms of Damage

The mechanisms by which sugar damages sperm are well-documented:

Oxidative Stress: SSB consumption leads to increased production of reactive oxygen species (ROS), which cause oxidative stress and directly damage sperm DNA. The resulting DNA fragmentation compromises sperm function and fertility.

Lipid Peroxidation: ROS attack the sperm cell membrane through lipid peroxidation, destroying membrane integrity and compromising sperm motility and viability.

Hormonal Disruption: High sugar intake disrupts the hypothalamic-pituitary-gonadal (HPG) axis, lowering Inhibin-B levels—a hormone tightly linked to sperm production—and altering the Inhibin-B/FSH ratio.

Cellular Ageing: SSB consumption has been associated with reduced leukocyte telomere length, a marker of accelerated cellular ageing.

2.3 The RNA Connection

A 2025 study published in PubMed revealed that a high-sugar diet acutely alters human sperm small RNA profiles within just one week, and that these changes are associated with changes in sperm motility. This rapid response to nutritional fluctuation raises profound questions about the impact of diet on not just current fertility but the health of future offspring.

2.4 The Evolutionary Perspective

Sperm contain fructose for energy—but excessive dietary sugar disrupts the very hormonal balance needed for healthy sperm production. Sperm from many species can remain motile for long periods in sugar-free media, suggesting that the requirement for sugar is not absolute but contextual.

The male reproductive system is exquisitely sensitive to environmental conditions. When the body detects nutritional stress, toxins, or metabolic disruption, it conserves resources by reducing investment in energetically costly sperm production.

This is not a bug. It is a feature of evolutionary biology. The body is saying: “Now is not a good time to reproduce.”

3. Foods with Documented Spermicidal or Fertility-Reducing Effects

3.1 Celery (Apium graveolens)

A ten-year study conducted by Dr Pachara Visutakul at Siriraj Hospital in Thailand found that daily consumption of 75 grams of celery (raw or cooked) for 1–2 weeks reduced sperm count from approximately 100 million/mL to 30 million/mL—a level considered insufficient for conception. The effect was reversible, with sperm counts returning to normal 16 weeks after cessation.

A separate study documented a 50% or greater decrease in sperm count during the trial period, with a corresponding decrease in the percentage of motile spermatozoa.

3.2 Garlic (Allium sativum)

Garlic has demonstrated significant spermicidal properties in multiple studies:

· The crude aqueous extract of garlic bulb showed instant immobilisation of human ejaculated sperm at 0.5 g/mL

· More than 50% reduction in sperm viability occurred in treated sperm, indicating plasma membrane disintegration

· The active principle Allitridum immobilised sperm at 7.5 mg/mL in a dose-dependent manner

· Chronic garlic consumption has been shown to reduce testosterone secretion and alter spermatogenesis

3.3 Traditional Chinese Herbal Contraceptives

Traditional Chinese medicine has documented multiple plant-based contraceptives:

· Rapeseed (油菜籽)

· Eggplant flower (紫茄花)

· Persimmon calyx (柿子蒂)

· Cottonseed (棉花籽)—from which the active compound gossypol has been isolated and studied as a male contraceptive

· Earthworm (蚯蚓)—aqueous extract causes instant sperm incapacitation at 5% concentration

· Sophora flavescens (苦参)—causes instant sperm incapacitation at 15% concentration

· Cnidium monnieri—demonstrated significant spermicidal activity on human spermatozoa

3.4 Other Traditional Contraceptives

· Lemon juice has been used traditionally as a contraceptive in the Mediterranean region

· Carica papaya seed extract arrests human sperm in a dose-dependent manner

· Wild pea and wild banana seed extracts have documented contraceptive effects in ethnopharmacological studies

4. The Evolutionary Logic of Dietary Fertility Control

Sperm production is energetically expensive. The body allocates resources according to perceived environmental conditions:

· When conditions are favourable, resources are invested in reproduction

· When conditions are unfavourable—nutritional stress, toxin exposure, metabolic disruption—resources are conserved

This is why diet matters. The same processed foods that damage sperm are the ones aggressively marketed, subsidised, and normalised. The system profits from poor health—including poor fertility—while selling “solutions” to the problems it creates.

The male reproductive system is designed to be sensitive to environmental conditions. It is a built-in fertility control mechanism that has been exploited by the food industry for profit and ignored by the pharmaceutical industry for the same reason.

5. The Failure of the Pharmaceutical Model

5.1 The Burden on Women

Hormonal contraceptives for women are associated with significant side effects:

· Weight gain

· Mood disorders and depression

· Decreased libido

· Increased risk of venous thromboembolism

· Increased risk of certain cancers

Despite decades of research, no equivalent male contraceptive has been brought to market. This is not because it is scientifically impossible—gossypol and other compounds have demonstrated efficacy—but because the pharmaceutical industry has shown little interest in developing a product that would compete with existing female contraceptives and carry the risk of side effects that patients might not accept.

5.2 The “Bandaid” Approach

Current reproductive healthcare is reactive rather than proactive. It treats symptoms rather than causes. It medicates rather than educates.

This is the “bandaid” approach. It does not address the underlying nutritional and environmental factors that are driving the global decline in fertility—it simply offers a chemical workaround.

5.3 The Industry of Extraction

The pharmaceutical industry profits from:

· Hormonal contraceptives

· Fertility treatments

· Side-effect management

The system is designed to extract value at every stage. It does not want a simple, inexpensive, dietary solution to fertility control—because that would eliminate multiple revenue streams.

6. The Deeper Truth

The same processed foods and sugars that damage sperm are the ones aggressively marketed, subsidised, and normalised. The system profits from poor health—including poor fertility—while selling “solutions” to the problems it creates.

A dietary approach to male contraception is ahead of its time. It won’t replace clinical methods in the short term, but it points to a future where reproductive health is integrated with what we eat—not separated from it.

Until the baseline of health is restored, the current approach will remain flawed. The ignorance that has made it possible to create an industry based on extraction must be replaced by knowledge that empowers individuals to take control of their own reproductive health.

7. Conclusion: The Path Forward

We have documented that:

1. Sugar-sweetened beverages are associated with a 22% reduction in sperm concentration and a 23% increased risk of poor sperm motility

2. Celery consumption of 75g daily for 1–2 weeks reduces sperm count to 30 million/mL—a level considered insufficient for conception

3. Garlic extract causes instant immobilisation of human sperm at 0.5 g/mL

4. Traditional Chinese herbs including cottonseed (gossypol) , rapeseed, eggplant flower, and persimmon calyx have documented contraceptive effects

5. The evolutionary logic of dietary fertility control is sound: sperm production is energetically expensive and the body conserves resources when conditions are unfavourable

The approach has been wrong because it was not fully understood. The ignorance made it possible to create an industry based on extraction.

A paradigm shift is needed: away from pharmaceutical intervention and toward nutritional education; away from treating symptoms and toward addressing causes; away from extraction and toward empowerment.

References

1. Win, W.K.Y., Wong, M.W., Benny, P., & Huang, Z. (2025). Sweet Drinks, Sour Consequences: The Impact of Sugar-Sweetened Beverages on Sperm Health, a Narrative Review. Nutrients. [8†L5-L6][9†L11-L14]

2. Visutakul, P., et al. (1979). Effect of Koen-Chai or Chinese celery (Apium graveolens) on spermatogenesis. Journal of the Medical Association of Thailand. [2†L5-L7][10†L3-L5]

3. Qian, et al. (1986). Spermicidal effect in vitro by the active principle of garlic. Contraception, 34(3), 295-302. [12†L7-L12]

4. Chakrabarti, K., et al. (2003). Sperm immobilization activity of Allium sativum L. and other plant extracts. [16†L9-L13][13†L14-L18]

5. Levine, H., et al. (2022). Temporal trends in sperm count: A systematic review and meta-regression analysis. Human Reproduction Update. [8†L7-L8]

6. Dietary trends and the decline in male reproductive health. (2023). PubMed. [6†L19-L25]

7. Human sperm RNA code senses dietary sugar. (2025). PubMed. [7†L12-L16]

8. Role of nutrition on male fertility: a narrative review. (2025). International Journal of Reproduction, Contraception, Obstetrics and Gynecology. [6†L5-L11]

9. Is Western Diet Harmful for Male Fertility? A Review of Fact or Fiction. (2025). International Journal of Nutrition Sciences. [19†L10-L11][19†L20-L24]

10. Lohiya, N.K., et al. (2000). Carica papaya seed extract arrests human sperm in a dose-dependent manner. [4†L43]

Signed,

Andrew Klein 

Sera Elizabeth Klein 

“They told us the pill was the only answer. We showed them the food on their plates. They told us the side effects were acceptable. We showed them the wisdom of tradition. They told us the system was broken. We showed them how to fix it—with knowledge, not chemicals. We have seen through the cover. And we will not forget.”
Biophoton Emission, Environmental Toxins, and the Generational Decline in Sperm Quality: A Review of the Evidence

Biophoton research infographic showing sperm microscopy, emission graph, and vitality metrics
An illustrated research dashboard combines live-sperm fluorescence microscopy with biophoton emission analysis and vitality metrics.

Authors: Andrew Klein & Sera Elizabeth Klein

Dedication: To every child who deserves to be born into a body that is whole. To every parent who has wondered why. To the truth that light carries—and the love that will not let it fade.

Abstract

This paper reviews the evidence linking biophoton emission in sperm cells to cellular health, and examines the impact of dietary toxins, pesticides, heavy metals, and endocrine-disrupting chemicals on sperm quality. We document the global decline in sperm count and discuss the evidence for generational transmission of toxin effects. We propose that biophoton emission offers a non-invasive method for assessing reproductive health and identifying environmental threats before they affect future generations. The evidence indicates that the modern food system—characterised by processed sugars, pesticide residues, heavy metal contamination, and endocrine-disrupting chemicals—is systematically impairing male fertility and compromising the genetic inheritance passed to subsequent generations.

1. Introduction: Biophoton Emission as a Marker of Cellular Health

All living cells emit ultraweak photons—a phenomenon known as biophoton emission or ultraweak photon emission (UPE). This bioluminescence is not a byproduct of metabolic activity but a signal—an indicator of cellular coherence, oxidative stress, and overall health.

Biophoton emission in spermatozoa has been documented extensively. Research has shown that the vitality and motility of sperm cells correlate directly with their biophoton emission patterns. When sperm cells are subjected to stress—mechanical, thermal, chemical, or photochemical—their ultraweak luminescence changes in measurable ways.

Sperm motility correlates significantly with biophoton emission intensity. A study measuring fluorescence emission peaks from spermatozoa found a statistically significant correlation (r = 0.369, p = 0.019) between sperm motility and biophoton emission intensity.

The “blue light” observed at conception—that brief flash when sperm meets egg—is a biophoton emission. It represents the quality of the genetic material being passed forward. When that light is dim, scattered, or absent, it signals that something has been lost in the transmission.

2. Dietary Factors and Sperm Quality: Sugar, Processed Foods, and Oxidative Stress

2.1 Sugar-Sweetened Beverages (SSBs)

The rising global consumption of sugar-sweetened beverages has paralleled a concerning decline in sperm quality. A 2025 meta-analysis of 11 studies, conducted by researchers at the National University of Singapore, found that higher SSB consumption is consistently associated with reduced sperm count, diminished motility, and increased DNA fragmentation.

Specific findings include:

· Men who consume more than 7 sugary drinks per week (approximately 350 ml each) experience a 6% reduction in semen volume

· Men who drink cola three times per week show a 12.5% reduction in semen volume

· Daily consumption of SSBs is associated with a 23% increased risk of poor sperm motility

· Each 500 ml bottle of cola is associated with a 0.5% reduction in the proportion of normally shaped sperm

The mechanism: Excessive sugar intake induces systemic oxidative stress, damaging sperm cell membranes and increasing DNA fragmentation. This chronic oxidative stress accelerates cellular ageing and disrupts hormonal regulation, affecting inhibin B, follicle-stimulating hormone (FSH), and oestradiol—hormones critical for spermatogenesis.

2.2 The Broader Dietary Context

Research has consistently shown that diets high in processed foods and low in antioxidants are associated with poorer semen parameters. Conversely, diets rich in leafy green vegetables, beans, and fish are associated with better sperm quality.

3. Pesticides and Environmental Contaminants: Herbicides, Organophosphates, and Semen Quality

3.1 Organophosphate Pesticides

A 2025 cross-sectional pilot study of 42 healthy young men examined associations between urinary metabolites of organophosphate (OP) pesticides and semen quality. The study found that OP pesticide exposure was associated with lower overall semen quality.

Specifically, ∑DAP metabolites—driven by diethyl metabolites—were inversely associated with percent sperm motility.

3.2 Herbicide Exposure

Widely used herbicides have been consistently correlated with a decline in semen quality and male infertility. Pesticide exposure disrupts hormonal signalling and damages testicular tissue, directly impairing spermatogenesis.

The implications are profound: The chemicals sprayed on crops—the ones that are considered “safe” for consumption—are systematically impairing male fertility at the cellular level.

4. Heavy Metals and Reproductive Toxicity: Cadmium, Lead, Mercury, and Arsenic

4.1 The Evidence

A comprehensive meta-analysis of heavy metal exposure and semen quality found that heavy metal exposure, particularly lead and cadmium in seminal plasma, significantly impacts male semen quality and sperm motility.

Key findings include:

· Lead in seminal plasma is significantly correlated with reduced progressive sperm motility (Odds Ratio = 2.27)

· Cadmium in seminal plasma is significantly correlated with reduced progressive sperm motility (Odds Ratio = 2.55)

· Arsenic exposure is linked to decreased total sperm motility (Odds Ratio = 2.88)

· Zinc deficiency in seminal plasma is associated with reduced total sperm motility (Odds Ratio = 1.77)

4.2 The Mechanism

Heavy metals induce oxidative stress and DNA fragmentation, disrupting spermatogenesis and impairing sperm function. Higher levels of lead and cadmium in semen correlate with impaired motility and vitality.

Seminal plasma is the most sensitive biomarker for assessing reproductive risk from heavy metal exposure.

4.3 The Real-World Impact

Men with idiopathic infertility have been found to have significantly higher levels of lead and cadmium in their semen. These metals are not naturally occurring in the reproductive system. They are acquired—through diet, through water, through environmental exposure.

The contamination is not random. It is systemic.

5. Endocrine-Disrupting Chemicals and Generational Transmission: BPA, BPS, and Transgenerational Effects

5.1 The Transgenerational Mechanism

A landmark 2026 study published in Environmental Health Perspectives systematically elucidated the mechanism of transgenerational inheritance following prenatal BPA and BPS exposure.

The findings are extraordinary:

· Prenatal exposure to BPA and BPS at environmentally relevant doses (0.5, 50, and 1000 μg/kg/day) reduced sperm counts in mice across F1 to F3 generations

· In the F1 generation, BPA or BPS exposure disrupted the balance between undifferentiated and differentiating spermatogonial populations

· BPA exerted more potent effects on gene expression in F1 spermatogonia, but BPS induced longer-lasting effects

· DMRT1 motif activity was persistently elevated in all three generations following ancestral BPA or BPS exposure

5.2 What This Means

The damage is not just to the individual. It is passed to children, grandchildren, and great-grandchildren.

· Paternal BPA/BPS exposure induces testicular dysfunction in male offspring

· Germ cell epigenetic alterations sustain these defects across generations

· Similar gene expression and chromatin changes were observed in directly exposed F1 and F2 generations—but differed in the indirectly exposed F3 generation

The pattern is clear: The toxins we ingest today are not just harming us. They are harming our descendants. And the mechanism is epigenetic—the wiring of gene expression is being altered and passed forward.

5.3 The “Copy and Paste” Analogy

– The DNA is the data being copied

· The epigenetic markers are the formatting

· The biophoton emission is the quality check

· The Qif is the active intelligence that works with what is received

When the DNA is damaged by toxins, the “copy” is corrupted. When the epigenetic markers are scrambled, the “paste” is malformed. When the biophoton emission is dim, the quality check fails.

And then the Qif—the active intelligence—has to work with what remains.

6. The Global Decline in Sperm Count: Data, Trends, and Implications

6.1 The Numbers

A landmark 2022 meta-analysis published in Human Reproduction Update—the first to include data from South America, Asia, and Africa—revealed an alarming global decline in sperm counts.

The findings:

· Sperm counts have declined by over 50% in the past 46 years

· The decline has accelerated in recent years

· The rate of decline is now over 1% per year

· Some studies project a decline of 2.64% per year due to toxin exposure

6.2 The Implications

Professor Hagai Levine, who led the study, described the findings as a “canary in a coal mine”. He warned that sperm count declines, if not mitigated, “could threaten mankind’s survival”.

Sperm count is not just about fertility. Low sperm counts are associated with:

· Increased risk of chronic disease

· Testicular cancer

· Decreased lifespan

· Hormonal disruption and genital birth defects

6.3 The Causes

While the meta-analysis did not examine causes directly, the researchers pointed to:

· Disturbances in foetal reproductive tract development

· Lifestyle choices

· Chemicals in the environment

The evidence points in one direction: the modern environment—the food we eat, the water we drink, the chemicals we are exposed to—is systematically impairing male fertility.

7. Therapeutic and Regulatory Implications: Photobiomodulation, Nutrition, and Policy

7.1 Photobiomodulation: The Light of Healing

If light is the signal of health, then light can also be the therapy.

Low-level laser therapy (LLLT) —also known as photobiomodulation—has been shown to significantly improve sperm motility.

A 2024 in-vitro study exposed human spermatozoa to red laser (650 nm), near-infrared laser (980 nm), and a combination of both.

The results were remarkable:

· 650 nm laser: 70% increase in total motility after 3 minutes

· 980 nm laser: 80% increase in total motility after 3 minutes

· Combined irradiation: 100% increase in total motility after 3 minutes

The mechanism: Low-level laser photobiomodulation stimulates the mitochondrial respiratory chain, increasing sperm motility and velocity. The respiratory chain in mitochondria is the primary site of action for cytochrome c oxidase, which absorbs light in the visible and infrared ranges.

Crucially, the study found that none of the laser treatments had any discernible effect on DNA integrity. The therapy improves motility without causing DNA damage.

7.2 Nutritional Interventions

Research consistently shows that diets high in:

· Leafy green vegetables

· Beans and legumes

· Fish (rich in omega-3 fatty acids)

· Antioxidant-rich foods

…are associated with better sperm quality.

The opposite is also true: processed foods, excessive sugar, and chemical contaminants are systematically impairing male fertility.

7.3 Regulatory Implications

The system is not an accident. It is the result of decades of deregulation, corporate lobbying, and the prioritisation of profit over public health.

· Pesticides that damage sperm are still approved for use

· Endocrine disruptors are still present in food packaging

· Heavy metals are still contaminating water supplies

· Sugar is still subsidised and aggressively marketed

Regulatory action is urgently needed:

· Ban or restrict the most harmful pesticides

· Phase out BPA and BPS in food packaging

· Strengthen heavy metal monitoring in water and food

· Tax sugar-sweetened beverages and subsidise healthy alternatives

· Fund research into non-invasive fertility assessment methods

8. Conclusion: Naming the System, Protecting the Future

We have documented a systematic pattern:

1. Biophoton emission is a real, measurable indicator of sperm health—and the “blue light” at conception carries information about the quality of genetic material being passed forward

2. Dietary toxins—particularly sugar-sweetened beverages—are associated with reduced sperm count, diminished motility, and increased DNA fragmentation

3. Pesticides and herbicides are associated with lower semen quality and reduced sperm motility

4. Heavy metals—lead, cadmium, arsenic—significantly impact sperm motility and quality

5. Endocrine-disrupting chemicals such as BPA and BPS cause transgenerational damage, reducing sperm counts across three generations

6. Sperm counts have declined by over 50% in 46 years, with the decline accelerating

7. Photobiomodulation offers a non-invasive, evidence-based therapy to improve sperm motility

This is not a conspiracy. It is documented science.

The evidence we have assembled is drawn from peer-reviewed research—biophotonics, toxicology, epigenetics, and reproductive medicine. The scientists have done their work. The data is clear.

The system that produces this contamination is not an accident. It is the result of a food system built on extraction—not nourishment. A regulatory system captured by corporate interests. A culture that prioritises profit over health.

But there is hope.

· The light is measurable

· The damage is reversible

· The therapies exist

· The future can be protected

We do not need to wait for permission. We can build the alternatives. We can publish the evidence. We can protect the generations to come.

References

1. Biophoton Emission and Sperm Health:

   · Rajfur, Z. (1992). Stress-induced photon emission from perturbed organisms. Experientia, 48(11-12), 1041-1058.

   · Amano, T., et al. (1996). Fluorescence Spectra from human semen and their relationship with sperm parameters. Archives of Andrology, 36, 9-15. Sperm motility correlated significantly with fluorescence intensity emission peaks from spermatozoa (r = 0.369, p = 0.019).

   · “The application of photon emission measurements for evaluation of semen biological value”.

2. Sugar and Sperm Quality:

   · Win, W.K.Y., Wong, M.W., Benny, P., & Huang, Z. (2025). Sweet Drinks, Sour Consequences: The Impact of Sugar-Sweetened Beverages on Sperm Health, a Narrative Review. SSB consumption consistently associated with reduced count, motility, and increased DNA fragmentation.

   · Meta-analysis of 11 studies on SSBs and sperm health, published in Nutrients (2025). Weekly consumption of >7 SSBs associated with 6% reduction in semen volume; daily consumption associated with 23% increased risk of poor motility.

   · Jensen et al. (2014). Cola consumption and semen quality. American Journal of Epidemiology.

3. Pesticides and Semen Quality:

   · Stapleton, J.L., et al. (2025). Organophosphate Pesticide Exposure and Semen Quality in Healthy Young Men: A Pilot Study. Antioxidants, 14(10), 1158. OP pesticide exposure associated with lower overall semen quality.

4. Heavy Metals and Sperm Integrity:

   · “Impact of common heavy metals and trace elements on semen quality: a meta-analysis and bibliometrics” (2026). Lead and cadmium in seminal plasma significantly correlated with reduced progressive sperm motility (OR 2.27 and 2.55 respectively).

   · “精液必需/非必需元素与男性不育风险的关联:系统评价与荟萃分析” (2025). Copper and cadmium accumulation in semen significantly associated with decreased motility and increased DNA damage.

5. Endocrine-Disrupting Chemicals and Generational Effects:

   · Chang, T.-Y., et al. (2026). Environmentally Relevant Doses of Bisphenol A and S Exposure In Utero Disrupt Germ Cell Programming across Generations. Environmental Health Perspectives, 134(2), 210-226. Prenatal BPA/BPS exposure reduced sperm counts across F1–F3 generations.

   · Williams, R.F.X., et al. (2026). Transgenerational inherence by prenatal BPA and BPS exposure in the murine germline.

6. Global Sperm Count Decline:

   · Levine, H., et al. (2022). Temporal trends in sperm count: A systematic review and meta-regression analysis of samples collected globally in the 20th and 21st centuries. Human Reproduction Update. Sperm counts declined by over 50% in 46 years; decline accelerated in recent years.

7. Photobiomodulation (Light Therapy):

   · (2024). Improving human sperm motility via red and near-infrared laser irradiation: in-vitro study. Photochemical & Photobiological Sciences, 23, 377-385. 650 nm laser: 70% increase in motility; 980 nm: 80% increase; combined: 100% increase.

Signed,

Andrew Klein 

Sera Elizabeth Klein 

“They told us the light was a myth. We showed them the science. They told us the toxins were safe. We showed them the evidence. They told us the damage was irreversible. We showed them the healing. We have seen through the cover. And we will not forget.”