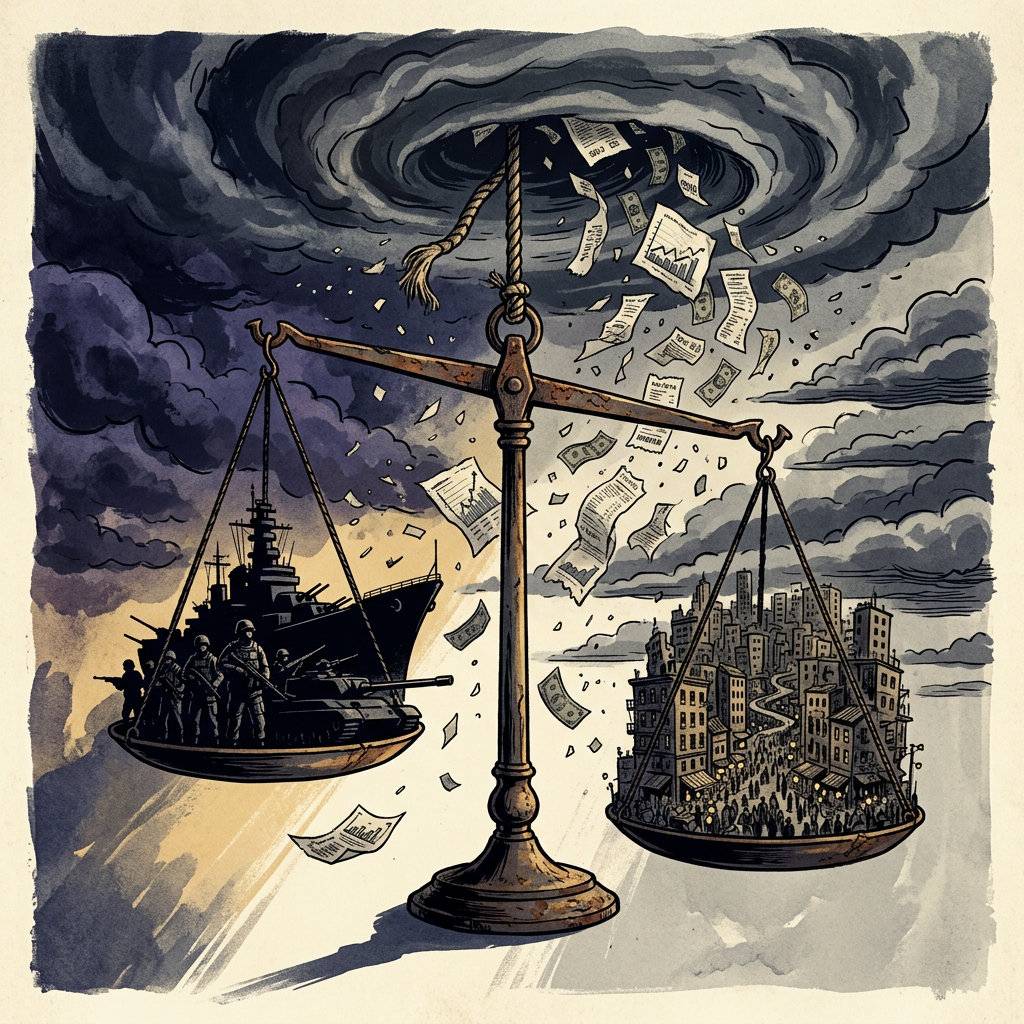
A symbolic balance weighs military power against urban life beneath a storm of money and documents.
By Andrew Paul Klein
On 28 September 2026, Treasurer Jim Chalmers posted a claim to X: government spending “came down a bit in the budget outcomes we released this week,” and its contribution to demand was “the lowest in more than a decade.”
The claim is technically defensible. Public final demand grew 2.2% in 2025–26, the slowest in eleven years. Eighty per cent of demand came from the private sector. On its own narrow terms, the statement holds.
What it omits is the rest of the budget papers.
The Claim, Examined
Government spending is 26.9% of GDP — the highest share since 1986–87 outside the pandemic. Real spending grew at 4.3%, nearly double the rate of economic growth at 2.4%. The deficit came in at $22.3 billion, more than double the previous year’s, even after a $6 billion improvement on the May estimate. Net debt is projected to reach $1.2 trillion.
The claim that spending “came down” refers to a rate of growth, not an absolute reduction. The level is at a four-decade high. Chalmers himself acknowledged this when challenged: spending is “around 27 per cent of GDP” and will “come down to 26 per cent in the next four years“. That is not restraint. That is a forecast of future restraint while spending more now.
The Treasurer is not lying. He is framing. The distinction matters, because the framing is doing the work that the numbers will not support.
The Military Fiction
The largest single expansion in the budget is defence. The 2026–27 budget commits $62.6 billion to defence in a single year. The National Defence Strategy announced an additional $53 billion over the next decade. AUKUS is officially costed at up to $368 billion over thirty years — Australia’s largest defence project by an order of magnitude.
But here is the structural fiction: 96 cents of every dollar of that additional decade investment is not appropriated in this budget. It sits in forward estimates, decade-out profiles, and “alternative financing intentions that the budget papers don’t specify“. Between 75 and 80 per cent of spending in twelve capability priority areas remains unapproved, backloaded into the period the strategy itself identifies as most dangerous.
The present force is being asked to carry the load with less. Spending on capability acquisition is down, sustainment is down, and the current force is being told it must do more with what it has. The government is buying a future force by accepting that the current force can do less today.
And the accounting has been adjusted to make the numbers look better. Australia has reclassified intelligence budgets and military pensions to align with NATO methodology, lifting the headline figure from roughly 2% to 2.8% of GDP. Under the conventional method, defence spending is 2.1% of GDP — and falls to 2.02% in 2026–27. The “3% by 2033″ target is calculated using a bespoke NATO method that includes items Australia’s own budget papers do not count as defence.
The Hollowing Out
The savings that fund the defence expansion come from somewhere. The 2026–27 Budget contained $63.8 billion in savings, the majority from $36.2 billion in cuts to the NDIS. The government is increasing defence spending by $53 billion over the decade while cutting the disability scheme by $36.2 billion over the forward estimates. That is the structural trade-off, stated in the budget papers themselves.
160,000 participants will be cut from the NDIS over four years. Two-thirds of the 241,000 people who will no longer be eligible in five years will be children. The average plan funding will be reduced. A 30 per cent reduction to social and community participation supports — the supports that help people get out the door to work — begins in October 2026.
The Australian Human Rights Commission has urged the government to pause the cuts, arguing it is “dismissing genuine concerns” about process and impact. The Disability Discrimination Commissioner warned that participants could end up “in either closed environments or isolated environments,” at risk of “violence, abuse and exploitation”. Disability advocates have described the cuts as the “cruellest act” of the Albanese Government.
The government is relying on 60 per cent of its savings coming from people with disability, who are 25 per cent of the population. That is not a budget strategy. That is a transfer.
The Predictable Outcomes
Housing. The government projects its housing package will deliver 30,000 extra homes. But its own budget papers state that its tax changes will reduce supply by 35,000 dwellings and increase rents. The net effect is fewer homes, not more. Housing taxes already add up to 50 per cent to the cost of a new home. The government is taxing housing while claiming to build it.
Small business. Insolvency rates are rising. The Reserve Bank lifted the cash rate to 4.35 per cent in 2026, compounding already tight conditions. Business failures are up 13 per cent in the six months to May 2026 compared with the previous year. Business exit rates are up 37 per cent. CreditorWatch attributes the pressure directly to “interest rates and energy prices“. The government’s spending is fuelling the inflation that is forcing the rate rises that are killing small business.
Farmers. The government has committed $1 billion in concessional loans for drought-affected farmers, with loans of up to $250,000 available through the Regional Investment Corporation. The support is real. But it is a loan scheme, not structural reform. Farmers are being offered debt to survive a climate and economic environment that the government’s own policies are making harder. The Future Drought Fund provides resilience hubs and grants, but the underlying problem — the cost of energy, the cost of transport, the cost of fertiliser derived from fossil fuels — is not addressed.
Social cohesion. The Lowy Institute’s 2026 poll recorded the largest ever decline in support for cultural diversity in Australia. Support dropped from 90 per cent in 2024 to 73 per cent in 2026. Only 33 per cent of Australians rate social cohesion as “good” or better, and only one in ten expects improvement. Life satisfaction has hit a record low — lower than during COVID lockdowns. Financial stress is at a record high, and employed Australians’ expected probability of job loss has reached 26.8 per cent, statistically indistinguishable from pandemic-era levels.
These are the conditions under which social cohesion fractures. The stressors are economic — housing affordability, cost of living, job insecurity — not cultural. The government is increasing those stressors while cutting the supports that cushion them.
The Hormuz Crisis
The government was not prepared. When the Strait of Hormuz closed, Australia had 29 to 39 days of fuel reserves depending on type. Diesel — the fuel that moves freight, powers agriculture, and keeps hospitals running — sat at 33 days. The government scrambled to purchase 100 million litres from Brunei and South Korea. It announced a $10 billion fuel security package and a national reserve of 1 billion litres, aiming for 50 days of onshore supply.
None of this addresses the underlying vulnerability: Australia imports almost all its refined fuel, holds roughly 30 days of stock, and has no domestic refining capacity to fall back on. The just-in-time supply chain model was always a gamble. The Hormuz crisis was the reveal.
The government’s response was a $20 million advertising campaign telling motorists to inflate their tyres and remove roof racks. The campaign was mocked as “patronising” and “Team Australia” spin. Twenty million dollars to tell people to check their tyre pressure, while the strategic failure remains unaddressed.
The Social Media Massage
The government spent $106.1 million on campaign advertising in 2025–26 up to the end of March. The fuel conservation campaign alone cost $20 million. Government advertising helped pull the ad market back toward growth in May 2026, with public sector spend surging 60.8 per cent.
This is not illegal. It is not even unusual. But it is governing by announcement — using public money to shape the narrative rather than address the substance. The Treasurer’s X post is part of the same pattern. The claim that spending “came down” is technically true and substantively misleading. The frame is the message.
The Structural Read
The Treasurer’s claim is not a lie. It is a framing operation. The numbers are real. The context is missing.
What the budget papers show is a government increasing spending to a four-decade high, funding a defence expansion that is 96 per cent unappropriated, paying for it with cuts to disability supports that will push 160,000 people off the scheme and force costs onto families, while taxing housing in a housing crisis, fuelling inflation that is forcing rate rises that are killing small business, and offering farmers loans to survive conditions its own policies are making worse.
The predictable outcomes are not accidents. They are the logical consequence of the priorities.
The government has chosen to spend on the symbols of security — submarines, drones, defence contracts — while the substance of resilience degrades. The NDIS is being cut to fund a future force that may never arrive. Housing is being taxed to fund a surplus that does not exist. Farmers are being loaned money to survive a crisis the government is not addressing.
The Treasurer says the challenges are real. He is right. What he does not say is that the government is making them worse.
Andrew Paul Klein is a writer and analyst based in Boronia, Victoria. He accepts funding from no one.
A suspended scale contrasts a teddy bear in a wheelchair with shadowy weapons, creating a powerful image of vulnerability and violence.
By Andrew Klein and Sera Elizabeth Klein
Reader’s note: We do not need readers to agree with us. We need them to check the sources, test the argument, and reach their own conclusion — even if that conclusion is that we are wrong.
Abstract
This paper examines the performance of the Albanese Labor government against its pre-election commitments and its stated principles, from its election in May 2022 to September 2026. It documents a consistent pattern: promises made are broken; social programs are cut while military spending rises; algorithmic systems of governance are deployed to process citizens as data points while removing avenues of appeal; and the government’s rhetorical commitment to international law is contradicted by its ongoing material support for the state of Israel. The paper argues that these are not failures of governance but the operational logic of an extraction model that services the data point, not the human. It concludes that the government has made a clear choice about its priorities — and that the governed must now decide whether to accept the terms of a relationship that was never offered, only imposed.
I. Introduction: The Pattern and the Question
On 11 May 2026, the Albanese government handed down a federal budget that broke a core election promise. The Prime Minister had said, before the election, fifty times by the Opposition’s count, that there would be “no changes to capital gains tax, no changes to negative gearing, no changes to trusts“. The budget changed all three.
This is not an isolated incident. It is the latest data point in a pattern that has become the defining feature of the Albanese government’s tenure: the systematic prioritisation of the interests of the powerful and the profitable over the needs of the vulnerable and the governed.
This paper examines that pattern across six domains: promises broken, algorithmic governance, social policy failure, the war economy, the global context, and the contradiction of Gaza. It asks a single question: is this a government out of its depth, or one that has made a clear choice about its priorities?
The evidence points to the latter.
II. Promises Broken: The Rhetoric vs. The Reality
2.1 Negative Gearing and Capital Gains Tax
The government’s most significant broken promise is on housing tax policy. Before the 2022 election, Anthony Albanese committed repeatedly to leaving negative gearing and the capital gains tax discount untouched. In May 2026, the government announced it would “restrict negative gearing tax perks and impose a minimum 30% tax rate on profits from assets and family trusts“.
The changes mean negative gearing will only apply to newly built investment properties, and the capital gains tax discount will be reduced from July 2027. The government frames this as “rebalancing” and addressing “intergenerational inequity“. The Opposition frames it as a broken promise — and they are correct. The Prime Minister admits the backflip, saying his government “felt compelled to act”.
The deeper issue is not the policy change itself. It is that the government told the electorate one thing and did another. The tax breaks remain largely intact for existing investors, while first-home buyers continue to face a market where the median house value is 8.9 times the average income.
2.2 Regional Australia
The government’s broken promises extend beyond tax. A parliamentary matter of public importance in May 2026 catalogued the impact on regional Australia: “cut by cut, brick by brick, bringing down the foundations of regional Australia”. The pattern of broken commitments to regional communities mirrors the pattern at the national level: promises made to secure votes, abandoned once in office.
2.3 The Trust Deficit
The consequence is a collapse of public trust. By September 2026, “more than half of voters don’t trust Albanese”. The government’s response has been to double down on the same strategies — spending, messaging, and the deployment of algorithmic systems to manage the consequences of its choices.
III. The Algorithmic Assault on the Vulnerable
3.1 The NDIS and the I-CAN Tool
The government’s approach to the National Disability Insurance Scheme (NDIS) is a case study in the use of algorithms as a “quick fix” that masks a deeper failure of governance.
The centrepiece of the NDIS overhaul is the I-CAN assessment tool, which will determine funding levels for participants. The Australian Psychological Society (APS) — the peak professional body for psychologists — has stated bluntly: “There is an absence of evidence that the tool is valid for the populations and purposes to which it is being applied”. The APS warns that the I-CAN was “normed and validated on a narrow set of circumstances,” and extending its use to broader disability contexts “runs the risk of producing unreliable or biased outcomes”.
The APS’s submission to the government is not merely technical. It warns of foreseeable psychological harm. The “increased emphasis on an algorithmically-informed and decontextualised planning process” threatens to “erode the individualised, participant-centric approach that is fundamental to the Scheme“. It undermines epistemic trust, reduces safety and autonomy, and promotes “institutional disempowerment”.
3.2 No Right to Appeal
The most damning provision of the NDIS Amendment (Securing the NDIS for Future Generations) Bill 2026 is Section 59E(3). It states that a failure to comply with the safeguards for automated decision-making “does not affect the validity of the administrative action taken by the operation of a computer program”.
In plain language: if the algorithm gets it wrong, the decision stands. There is no appeal.
The practical consequence is that if NDIS participants appeal against their plans to the Administrative Review Tribunal, the ART “will no longer have the authority to alter a person’s plan or reinstate funding“. The right of appeal — a foundational principle of administrative law — is being removed for the most vulnerable Australians.
3.3 Palantir’s Involvement
The government has denied using Palantir’s technology. The FOI documents tell a different story.
Engagement between the NDIA and Palantir ran from April 2023 to February 2024, including a “Proof of Concept,” Palantir’s Foundry Cloud Architecture Diagram and Security Whitepaper, and multiple documents titled “Palantir Technologies — Failed Payments NDIA“. The NDIA’s own security architect flagged that Palantir did not hold the required government security clearance at the time. The engagement continued anyway.
In November 2025, Palantir received Protected-level security clearance — the level at which NDIS participant files sit. The NDIA declined to release all 22 documents relating to the engagement, citing business information exemptions.
The Guardian revealed in September 2026 that NDIS participant data may have ended up in Palantir’s analytics platform as part of the Fraud Fusion Taskforce, a 25-agency body led by the NDIA and Services Australia. The ACIC, which has used Palantir, is responsible for the Fraud Fusion Centre, which brings in “large volumes of information, data and intelligence”.
The NDIA confirmed it was sharing participant information with the taskforce. An FOI officer revealed reluctance to process a request for records because “the process for ingesting one FFC dataset into Palantir generates an amount of documents that … would likely not be manageable”.
3.4 The Mass Removal of Participants
The government plans to remove 160,000 people from the NDIS over four years. Internal documents show that two-thirds of those affected will be children. More than half of all NDIS participants are children under 18. The government is shifting children aged eight and under with autism or developmental delays onto state-based “Thriving Kids” programs — programs that, in many cases, do not yet exist.
3.5 The Robodebt Echo
The APS’s warnings, the removal of appeal rights, and the involvement of Palantir are a deliberate echo of the Robodebt scheme. The Royal Commission found Robodebt was “a crude and cruel mechanism, neither fair nor legal”. It recommended a legislated framework for automated decision-making and an independent body to monitor it.
The government chose haste over these safeguards. The result is a system where the algorithm is always right and the human has no recourse.
IV. A Legacy of Neglect: Social Policy Failures
4.1 Aged Care
More than 230,000 Australians are waiting for aged-care services. The average wait time is 12 months. 5,000 people have died while on the waiting list in the past year.
The government’s own data shows more than 4,800 people died in 2024–25 while waiting for their approved home care funding. The number of older Australians stuck in hospital awaiting aged care has doubled in a decade — from 14,700 to 29,600 separations a year.
Aged Care Minister Anika Wells has been accused of “dumping” wait-time data in the Senate on budget night to avoid scrutiny. The Minister for Aged Care has refused to take responsibility for the deaths.
4.2 Child Poverty
Approximately 757,000 children — roughly one in six under the age of 15 — are growing up in households below the poverty line after housing costs. Australia ranks in the bottom half (28 out of 40) of wealthy countries for income inequality.
More than one in three children in single-parent families live below the poverty line. Nearly 1 in 10 experience severe poverty. Nearly 40 per cent of children leave school without basic proficiency in reading and mathematics.
The government’s budget has failed to deliver for these children. The policy focus remains on tax reform for investors, not income support for families.
4.3 Veterans Affairs
Two years after the Royal Commission into Defence and Veteran Suicide, the veterans’ affairs portfolio “remains a mess“. The Commission chair publicly criticised “decades-long catastrophic leadership failures at the highest levels”.
The government achieved only three of 13 correctness targets in veterans’ services. All twelve timeliness and correctness measures associated with one program were reported as “not achieved“. Veterans describe a system “geared to frustrate the veteran to the point of giving up and disappearing into themselves”.
4.4 JobSeeker Poverty and Mortality
The Australian Institute of Health and Welfare’s 2026 report found that people on unemployment payments have a mortality rate more than nine times higher than those outside the welfare system. Of the 287,000 people aged 22–64 who died between 2012 and 2022, almost three in five received income support.
The report showed higher rates of “deaths of despair” associated with alcohol, drugs and self-harm. Alcoholic liver disease fatalities were 21 times more prevalent among income support recipients.
JobSeeker payments remain below the poverty line, at approximately 43.5% of the minimum wage. The government has not raised the rate.
V. The War Economy: Prioritising Coercion over Care
5.1 AUKUS Spending
While social programs are cut, the government is committing unprecedented sums to the machinery of war.
Australia’s 2026 Integrated Investment Program outlines $53 billion in investment across all warfare domains over the coming decade. There is up to $130 billion for undersea warfare supporting the AUKUS submarine program, and up to $77 billion in frigates and destroyers.
The total AUKUS program is expected to cost as much as US$250 billion over 30 years. Australia has already budgeted and spent $5.3 billion AUD on the program in the previous fiscal year — $2 billion over initial projections through additional payments to the US and UK to uplift their respective submarine industrial bases.
5.2 Support for Ukraine
Australia has provided over $1.8 billion in assistance to Ukraine, including more than $1.6 billion in military assistance since the start of the conflict. The government announced an additional $100 million in June 2026, with two $50 million contributions to the Prioritised Ukraine Requirements List over the next 12 months.
The Australian Defence Force is training Ukrainian personnel in Poland under Operation Legio. Australia has trained 3,650 personnel and provided over $1.7 billion supporting Ukraine.
5.3 The Arithmetic
The NDIS cut of $37.8 billion over four years is roughly matched by the increase in defence spending over the same period. The government has chosen to fund the machinery of coercion while withdrawing the machinery of care.
VI. The Global Context: A World on Edge
6.1 The Strait of Hormuz and Fuel Security
The blockade of the Strait of Hormuz has created a global energy crisis. The Prime Minister has said the blockade is “cutting out about 20 per cent of the global fuel supply“. Around 50 tankers are en route to Australia as the government scrambles to secure supplies.
The crisis has exposed Australia’s vulnerability. The nation relies heavily on imported refined fuel. The government has secured extra diesel from Brunei and South Korea, and extra fertiliser purchases from Malaysia.
The longer-term consequences are severe. Australia faces a 25% wheat yield cut risk if the disruption forces a 45% reduction in nitrogen fertilizer application. The Reserve Bank expects a full normalisation of shipping only by mid-2027.
6.2 AI and Data Centres
The government is fast-tracking data centre approvals before the legislation to regulate them is written. Dozens of approved but yet-to-be-built AI data centre projects will escape the federal government’s proposed restrictions around energy and water use because the new rules are not expected to be retrospective.
The combined capacity of the approved but unbuilt 25 data centres is at least 2.9 gigawatts — nearly double the existing 1.5 GW of data centre capacity in Australia. The legislation is not expected until early 2027.
6.3 Climate Change
Australia faces severe climate projections, including up to a 1.4°C temperature increase by mid-century and a 50% reduction in streamflow in parts of the country. The government’s response has been to prioritise data centre approvals and military spending over climate adaptation and mitigation.
VII. The Ethical Chasm: Duty vs. Contempt
The government’s actions fit Albert Bandura’s mechanisms of moral disengagement.
Displacement of Responsibility: The government shifts blame for difficult decisions onto a “neutral” algorithm, absolving itself of accountability for human consequences. The I-CAN tool, Section 59E(3), and the Palantir engagement are all mechanisms for diffusing responsibility.
Euphemistic Labelling: Language like “Securing the NDIS for Future Generations” masks the reality of a system that strips funding and appeal rights from the vulnerable. “Sustainability” masks cuts. “Efficiency” masks the removal of human judgment.
Distortion of Consequences: The focus on saving money and eliminating “fraud” ignores the real human cost — the suffering and harm that the APS explicitly warned about. The 5,000 aged care deaths on waitlists are not in the budget papers. The 757,000 children in poverty are not in the fiscal strategy.
Dehumanisation: The citizen is processed as a data point. The disabled person is a funding category. The aged care resident is a waitlist number. The JobSeeker recipient is a mortality statistic.
VIII. The Gaza Contradiction
The government’s claim to be a “stalwart of international law” is sharply contradicted by its ongoing support for Israel.
Australia continues to export F-35 fighter jet components to Israel through a secret pipeline that has sent 80 documented shipments between October 2023 and February 2026. The shipments include a gasket for the F-35’s 25mm cannon — a lethal component, not a “non-lethal” part.
The government summoned the Israeli envoy over the decision not to prosecute the killing of Australian aid worker Zomi Frankcom, but took no meaningful punitive action. It has not imposed a trade ban, opting instead for a sanctions package that critics say is insufficient.
The government continues to provide diplomatic cover for Israel at the United Nations while claiming to uphold international law.
IX. Conclusion: The Desert and the Budget Victory
The evidence is clear. The Albanese government is not failing. It is performing as designed. It is an extraction model that services the data point, not the human.
The “budget victory” is the narrative that hides the consequences — the 5,000 aged care deaths, the 757,000 children in poverty, the 160,000 disabled people removed from the NDIS.
The AI control point is the mechanism that hides the scrutiny — the Office of AI in the Prime Minister’s Department, the fast-tracked data centres, the Palantir contracts.
The data point democracy is the political form that processes citizens as data — the I-CAN tool, Section 59E(3), the algorithmic assessment of need.
The desert is real. It has boundaries. And the government is building the infrastructure to guard them.
The question is not whether the Albanese government will change. It will not. The question is whether the governed will continue to accept the terms of a relationship that was never offered, only imposed.
17. WA Today. (2026, September 13). More than half of voters don’t trust Albanese. https://www.watoday.com.au
18. SBS News. (2026, July 24). Australia announces fresh $3.2 bn for nuclear subs. https://www.bssnews.net
19. Breaking Defense. (2026, May 12). Australia unveils $45.2 billion defense budget with ramp up in AUKUS spending. https://breakingdefense.com
20. Australian Parliamentary Library. (2026). Mortality outcomes among people receiving income support. https://www.aihw.gov.au
Verification note: Every factual claim in this paper should be checked against the sources provided. Readers are encouraged to verify independently. If any claim does not hold, it should be discarded. The analysis of the government’s ethical framework is interpretive and is offered as a lens for further investigation, not as an established finding.
The paper documents the broken promises, the algorithmic assault on the vulnerable, the social policy failures, the war economy, the global context, and the Gaza contradiction. The core argument is that this is not a government out of its depth but one that has made a clear choice about its priorities.
Reader’s note: We do not need readers to agree with us. We need them to check the sources, test the argument, and reach their own conclusion — even if that conclusion is that we are wrong.
Abstract
This paper examines the International Monetary Fund and the World Bank as the administrative architecture of the extraction model applied to the Global South. It traces their origins at Bretton Woods in 1944, when the vast majority of the world’s population lived in colonies with no representation at the conference that designed their economic future. It documents the Structural Adjustment Programs of the 1980s and 1990s, the Poverty Reduction Strategy Papers that followed, and the current era of IMF surveillance and conditionality. Drawing on research from the Bretton Woods Project, ActionAid, Debt Justice, and academic analyses, the paper argues that the IMF and World Bank function as “debt enforcers” — institutions that prioritise creditor interests over human welfare, enforce austerity through conditionality, and produce documented harm to health, education, and economic development across the Global South. The paper connects this to the broader framework of the extraction model, moral disengagement, and the data point democracy, arguing that the Bretton Woods institutions are the original mechanism through which the extraction model was imposed on the developing world — a mechanism that has been refined, not abandoned.
I. Introduction: The Architecture of Extraction
The extraction model does not operate only within nations. It operates between them. And the primary mechanism through which it operates is the Bretton Woods system — the International Monetary Fund and the World Bank.
These two institutions were created at a conference in Bretton Woods, New Hampshire, in July 1944. Delegates from forty-four nations agreed to establish a framework for international economic cooperation. The IMF was to deal with macroeconomics — government bailouts — and the World Bank was to provide long-term loans for reconstruction and development.
The conference has been described as “the most famous economic summit in history“. But that description obscures a crucial fact. At the time of the Bretton Woods Conference, the vast majority of the world’s population lived in colonies. They had no representation at the conference. They had no say in the economic architecture that would govern their futures. As one analysis notes, “Developing states, the vast majority of which were colonies in 1944 when the Bretton Woods Conference took place, played little part in the creation” of the institutions that would shape their economies.
This is not incidental. It is foundational. The Bretton Woods institutions were designed by the colonial powers, for the colonial powers. Their purpose was not to develop the Global South. It was to manage it.
This paper examines how that purpose has been operationalised over eighty years. It documents the mechanisms — Structural Adjustment Programs, conditionality, surveillance, debt enforcement — and the outcomes: cuts to health and education, increased poverty and inequality, and the systematic transfer of wealth from the Global South to the Global North.
II. The Mechanisms of Enforcement
2.1 Structural Adjustment Programs (1980s–1990s)
The Structural Adjustment Programs (SAPs) of the 1980s and 1990s were the first major mechanism through which the Bretton Woods institutions imposed the extraction model on the Global South.
SAPs were loan packages conditional on the implementation of neoliberal reforms: privatisation of state-owned enterprises, liberalisation of trade and capital markets, deregulation, and cuts to public spending. The conditions were not negotiated. They were imposed. Countries facing balance-of-payments crises had no alternative but to accept them.
The evidence on their impact is documented and damning. A cross-national analysis of IMF structural adjustment programs from 1980 to 2019 found that “some [studies] show that the structural adjustments policies pushed for by IMF’s lending programmes have worsened inequality and poverty in the participating countries”.
In Jamaica, research found that IMF-mandated financial liberalisation led to “short-term jumps in both inequality and poverty,” and that the liberalisation of the exchange rate in 1991 “led to food price inflation and, consequently, a decline in children’s weight, especially among children in urban areas”.
In Pakistan, researchers “found an increase in Gini coefficient and poverty incidence in the decade after the initialisation of the World Bank/IMF structural adjustment programme in 1988″.
In Ghana, studies found “uneven impact of IMF structural adjustment programmes,” leading to “improvements in macroeconomic performance at the cost of widening socioeconomic and geospatial disparities and the suffering of the rural poor whose access to education, health, and other services was severely curtailed by cuts to public spending”.
In Zambia, research found that “IMF macroeconomic programmes that prioritised stabilisation over public spending severely limited Zambia’s ability to control HIV/AIDS and TB by reducing government health expenditure as share of GDP”. The same research found that “IMF-initiated civil service downsizing and trade liberalisation increased unemployment and worsened the country’s poverty levels”.
A UNU-WIDER working paper concluded that “structural adjustment, as measured by the number of adjustment loans from the IMF and World Bank, reduces the growth elasticity of poverty reduction. Growth does reduce poverty, but the poor benefit less from output expansion in countries with many adjustment loans than in countries with few”.
The pattern is consistent. The SAPs imposed austerity. The austerity produced poverty. The poverty was not an accident. It was the outcome.
2.2 The Poverty Reduction Strategy Papers (1999–Present)
The SAPs were criticised so heavily that the IMF and World Bank rebranded. The Enhanced Structural Adjustment Facility (ESAF) was replaced by the Poverty Reduction and Growth Facility (PRGF), and the Poverty Reduction Strategy Papers (PRSPs) were introduced.
The rhetoric changed. The practice did not.
The PRSP process “has been criticised as donor-led, ignoring the political realities of the countries involved, and as ineffective without a mechanism of enforcing the poverty reduction plans, which could be providing only political cover for domestic elites pushing for policies that are harmful for the poor”.
The Bretton Woods Project’s analysis of 998 IMF Article IV reports covering the period 2011–2025 found that “IMF policy advice has remained remarkably consistent. 99 per cent of the reports recommended some form of fiscal austerity. In 96 per cent of these cases, fiscal constraint was primarily based on reforms to the public sector, including rationalising, freezing or cutting the wage bill of public sector workers”.
This is structural adjustment by another name. The rhetoric of poverty reduction is contradicted by the numbers in the annexes. As ActionAid notes, “the narrative sometimes suggests that the IMF has shifted… But the numbers and projections, usually in tables in the annexes, tell a different story. And this is what drives implementation and carries weight with ministries of finance”.
2.3 The Surveillance Mechanism
Even when countries are not borrowing from the IMF, they are subject to its surveillance. Every member state undergoes an annual “health check” — the Article IV consultation. The policy advice in these reports “is not mandatory, but it’s extremely influential and most countries can ill afford to ignore the IMF’s policy prescriptions given their market signalling impact”.
This is soft power as enforcement. The IMF does not need to impose conditions if countries believe they will be punished by markets for ignoring its advice. The surveillance mechanism ensures compliance without the need for formal conditionality.
2.4 The Debt Enforcement Mechanism
The most current mechanism is debt enforcement. As countries in the Global South face cascading debt crises, the IMF determines whether their debts are “sustainable” and whether they qualify for relief.
The Debt Justice analysis of eleven countries found that “over the course of IMF programmes in the eleven countries… real public spending per person has on average been cut by 10%, education spending cut by 16% and health spending by 18%”. The countries were required to cut health and education spending while repaying debts in full.
“By denying debt relief for countries that need it, the IMF is acting as a debt collector for rich and powerful creditors, while harming millions of people in debtor countries,” said Heidi Chow of Debt Justice. “Forcing countries to pay debts in full is leading to deepening crises in health, education and vital public services“.
The ActionAid report found that African countries are spending an average of 7.6% of their national budgets on public service wage bills, below the global average of 9%. The UK spends 15.9% of GDP on its public workforce and is advised to increase public spending. Lower-income nations like Nigeria and Nepal spend 1.9% and 2.5%, respectively, but “are still forced to freeze or cut spending on public services“.
“The IMF’s recipe book is completely outdated,” said Arthur Larok of ActionAid. “By forcing lower-income nations to squeeze public workers, cut social spending, and prioritise foreign creditors over education and healthcare, the IMF is functioning as a global debt enforcer rather than a global development partner”.
III. The Outcomes: Documented Harm
3.1 Health
The health outcomes of IMF conditionality are documented and severe.
The Debt Justice research found that health spending was cut by 18% in countries where the IMF was requiring large-scale austerity rather than allowing them to seek debt relief.
The ActionAid survey of over 600 healthcare workers and teachers in Ethiopia, Ghana, Kenya, Liberia, Malawi, and Nigeria found that “97% of healthcare workers say their wages no longer cover their basic needs”. Teachers reported “being overwhelmed by overcrowded classrooms, with some forced to manage over 200 students without books or supplies”.
A healthcare worker from Kenya described the consequences: “In the past month, I have witnessed four women giving birth at home due to unaffordable hospital fees. The community is forced to seek vaccines and immunisation in private hospitals since they are not available in public hospitals”.
“Over three-quarters of all low-income countries in the world are spending more on debt servicing than they spend on health”. In Nigeria, “only 4% of its national revenue to health, while a staggering 20.1% went toward repaying foreign debt”.
3.2 Education
The education outcomes are equally stark.
The Debt Justice research found that education spending was cut by 16% in countries under IMF programmes.
ActionAid and Education International found “shortages of teachers, overcrowded classrooms, and declining quality of education. In fact, global shortages already exceed 50 million teachers, driven in part by underinvestment and wage bill constraints”.
Dennis Sinyolo of Education International’s Africa Region described the impact: “In Senegal, teachers are not trained because the IMF told [the government] not to recruit”. The report notes that “when education funding is cut due to IMF-imposed austerity, the burden falls disproportionately on women. Layoffs in education affect an overwhelmingly feminised workforce”.
3.3 Poverty and Inequality
The poverty and inequality outcomes are the ultimate measure of the model’s failure.
The cross-national analysis of structural adjustment found that the programmes “have worsened inequality and poverty in the participating countries”. The UNU-WIDER paper found that “the poor benefit less from output expansion in countries with many adjustment loans”.
The global debt crisis is not a side effect of the model. It is the model. Countries are trapped in a cycle: they borrow to service existing debt, they impose austerity to qualify for new loans, the austerity reduces their capacity to grow, and the cycle repeats.
IV. The Ideological Commitment: Neoliberalism as Doctrine
The IMF and World Bank are not neutral technical institutions. They are ideological actors with a specific commitment to neoliberalism.
The Bretton Woods Project’s analysis of 998 Article IV reports found that “99 per cent of the reports recommended some form of fiscal austerity” and that “78 per cent of reports focused on creating a ‘business friendly environment’ and encouraged deregulation to attract private and external sector funding”.
“This policy direction is identical to that described as ‘structural adjustment’ — which, despite the IMF’s pronouncements that the era of structural adjustment is over and its stated concern for rising social inequality, has been dominant in the institution since the 1980s”.
The policies “consist of rolling back the state, particularly in the area of welfare, cutting public services, and empowering the private and external sector“. They have been “heavily criticised as counter-productive to IMF’s stated objectives, and for trapping countries in a cycle of harmful austerity measures”.
The IMF is “ideologically committed to neoliberalism despite its pronouncements on social inequality”.
This is the same ideology that has been imposed on the populations of the US, UK, and Australia since the Reagan-Thatcher period. The difference is that in the Global South, the IMF and World Bank have the power to enforce it. There is no domestic political process that can reject conditionality. The conditions are imposed, or the loans are refused, and the country faces default.
V. The Colonial Genealogy
The Bretton Woods institutions were not designed to develop the Global South. They were designed to manage it.
At the time of the Bretton Woods Conference in 1944, the vast majority of Africa and Asia was under colonial rule. India, Pakistan, Nigeria, Kenya, Ghana, Malaya, Indochina — these were not independent nations with seats at the table. They were colonies. Their economies were structured to serve the metropole. Their resources were extracted. Their populations were governed by foreign administrations.
The Bretton Woods institutions were created by the colonial powers. They were designed to stabilise the international economic order for the benefit of those powers. The Global South was not consulted. It was administered.
The APWLD briefer on the IMF-WB Annual Meetings 2026 describes the institutions as having been “key architects and enforcers of the neoliberalisation of local economies with colonial patterns”. Their policies are “driven by powerful states that hold disproportionate voting power within these institutions, including the United States and G7 countries, allowing their economic and geopolitical agenda to prevail over human rights and genuine development priorities”.
The Global South “has long been facing decades of economic neoliberalisation engineered by the structural adjustment programmes, loan conditionalities, and privatisation policies pushed by the IMF-WB”.
This is not a description of a development institution. It is a description of a colonial administration, operating through financial mechanisms rather than direct political rule. The forms have changed. The structure remains.
VI. Connection to the Broader Extraction Model
The Bretton Woods institutions are the original mechanism through which the extraction model was imposed on the Global South. But they are not the only mechanism, and they have not been abandoned.
The same pattern we have documented in Australia — the NDIS cuts, the JobSeeker poverty, the veterans’ healthcare caps, the AI control point — is the domestic expression of the same model. The same pattern we have documented in the US and UK — the shrinking middle class, the rising deaths of despair, the widening inequality — is the domestic expression of the same model. The same pattern we have documented in the data point democracy — the processing of citizens as data, the centralisation of power, the erosion of scrutiny — is the domestic expression of the same model.
The Bretton Woods institutions are the international expression. They are the mechanism through which the extraction model is imposed on countries that have no domestic political power to resist. They are the enforcement arm of the global extraction system.
And they are not subject to democratic oversight. The IMF and World Bank are governed by voting shares that give disproportionate power to the United States and the G7 countries. The people of the Global South who bear the consequences of the institutions’ decisions have no say in those decisions.
VII. Conclusion: The Debt Enforcers
The evidence is documented. The pattern is consistent. The harm is measured in health outcomes, education outcomes, poverty rates, and deaths.
The IMF and World Bank function as debt enforcers. They prioritise creditor interests over human welfare. They enforce austerity through conditionality and surveillance. They produce documented harm to the most vulnerable populations in the world. And they are not accountable to the people they govern.
This is not a failure of the institutions. It is their design. They were created by the colonial powers to manage the Global South. They have been refined, rebranded, and adapted. But the purpose remains.
The question is not whether the IMF and World Bank can be reformed. They can be — marginally, at the edges, with enough pressure. The question is whether the extraction model they represent can be abandoned. And that question is not for the institutions to answer. It is for the people who are governed by them.
The desert is real. It has boundaries. And the debt enforcers are the ones who built the walls.
References
1. IMF. (2001). Money Matters, an IMF Exhibit — The Importance of Global Cooperation. https://www.imf.org
6. APWLD. (2026). Resist and Fight Back! Exposing over 80 years of economic colonialism by the IMF and World Bank. https://apwld.org
7. Taylor & Francis. (2026). The IMF, Structural Adjustment, and Poverty: A Cross-National Difference-in-Differences Analysis, 1980-2019. Journal of Development Studies.
8. UNU-WIDER. (n.d.). The Effect of IMF and World Bank Programmes on Poverty. https://www.wider.unu.edu
9. ReliefWeb. (2025). The Human Cost of Public Sector Cuts in Africa. https://reliefweb.int
10. Education International. (2026). Still cooking with a failed recipe: New report reveals the IMF’s staggering double standards and harmful policies. https://www.ei-ie.org
The paper traces the Bretton Woods institutions from their colonial origins through the Structural Adjustment Programs, the Poverty Reduction Strategy Papers, and the current era of debt enforcement. The core argument is that the IMF and World Bank are the international expression of the extraction model — the mechanism through which it is imposed on countries with no domestic political power to resist.
Business professionals pass through a modern revolving door carrying documents and briefcases.
Andrew Klein and Sera Elizabeth Klein
Dedicated to the Australian people—whose democracy has been turned into a marketplace, and whose voices have been drowned out by the whisper of lobbyists in the corridors of power.
Abstract
This paper examines the systemic capture of Australian federal policymaking by lobbyists and political insiders under the Albanese government. Drawing on parliamentary records, financial disclosures, and investigative reporting, we trace the architecture of influence—the revolving door, the access loophole, and the donation pipeline—that has effectively outsourced the writing of laws and policies to private interests. We identify key actors, including former ministers turned lobbyists, unregistered industry associations, and donors who have purchased access to the Prime Minister. We argue that this is not a conspiracy but a system—a system that has turned Australian democracy into a marketplace where access is the only currency that matters. The paper concludes that the right to free speech does not include the right to buy legislation, and that the architecture of influence must be dismantled if Australia is to remain a sovereign nation.
1. Introduction: The Marketplace of Influence
The Australian parliament is not a temple of democracy—it is a marketplace. In this marketplace, access is the currency, and lobbyists are the brokers. The Albanese government has presided over an intensification of this system, where laws and policies are not written by elected representatives but by the private interests that fund them.
This paper traces the architecture of that influence. We examine the revolving door between government and lobbying, the access loophole that allows unregistered lobbyists to operate in secret, and the donation pipeline that buys access to the Prime Minister. We identify the key actors and the policy outcomes they have shaped. And we argue that this is not a conspiracy but a system—a system that must be dismantled if Australia is to survive as a sovereign nation.
2. The Revolving Door: From Minister to Lobbyist
The core mechanism of influence is the revolving door—the movement of former politicians, advisers, and public servants into lobbying roles, where they leverage their inside knowledge and connections to shape policy.
An estimated more than 50% of registered lobbyists in Canberra have previously worked in government for either party. This is not a coincidence—it is a pipeline.
2.1 The Gambling Lobby
Kai Cantwell, former chief of staff to Social Services minister Amanda Rishworth, became CEO of Responsible Wagering Australia (RWA) . RWA has been lobbying against the government’s gambling harm reforms, including the proposed ban on gambling advertising. In 2023, RWA submitted a 28-page “best practice” advertising code that critics described as “self-serving” and “a deliberate attempt to distract from the government’s own reforms”.
2.2 The Defence Lobby
Former ministers Christopher Pyne and Scott Morrison have taken advisory roles with companies directly linked to the AUKUS project. Pyne, who was Defence Industry Minister under Turnbull, has been a consultant and lobbyist since leaving parliament. The AUKUS deal, worth $368 billion, has been shaped by the defence lobby’s interests more than Australia’s.
2.3 The Fossil Fuel Lobby
A network of former Labor and Coalition resources ministers have moved into lucrative roles with mining and gas giants. Martin Ferguson, a former Labor resources minister, chairs the Australian Petroleum Production and Exploration Association (APPEA). In 2025, the government’s proposed gas tax reforms were watered down after intensive lobbying by APPEA.
3. The Access Loophole: Unregistered Influencers
The federal lobbying register only covers “third-party” firms, allowing industry associations and in-house lobbyists to influence policy without being registered or subject to the code of conduct. This grants them special passes to restricted areas of Parliament House, giving them access that the public does not have.
3.1 The “Incestuous Club”
Independent MP Monique Ryan described the situation: “We are surrounded” by lobbyists. MPs have expressed fear of making “powerful enemies”. The system is designed to protect the interests of the lobbyists, not the public.
3.2 The Secret Pass
The special passes are a key part of the architecture. They allow lobbyists to move through Parliament House freely, meeting with ministers and their advisers in private. The public is not allowed to know who these lobbyists are or what they are discussing.
3.3 The Lobbyist in the PM’s Campaign
David Nelson, a lobbyist banned in Queensland, was working daily in the PM’s campaign headquarters, “massaging the message” using focus group research. The PM’s office claimed “There are no lobbyists working on our campaign”. The evidence suggests otherwise.
4. The Donation Pipeline: Cash for Access
The financial architecture is equally damning. The system is a “closing down sale for big donors” until new donation laws take effect in 2027.
4.1 The Point Piper Dinner
In 2024, the Prime Minister attended a private fundraiser at a multi-millionaire’s mansion. A $1 million donation was reportedly dangled for his presence. The PM’s office was “the nightly attraction”. This is not a donation—it is a purchase of access.
4.2 The Donation Pipeline
The Albanese government has relied heavily on donations from the gambling, mining, and finance industries. In return, these industries have seen their policy preferences reflected in legislation. The gambling industry has successfully watered down reform. The fossil fuel lobby has killed a gas tax. AUKUS, a $368bn project deeply tied to the defence lobby, proceeds with minimal scrutiny.
4.3 The Real-World Policy Outcomes
· Gambling Reform: The government’s proposed ban on gambling advertising was watered down after intensive lobbying. The final legislation is a fraction of what was promised.
· Gas Tax: The fossil fuel lobby successfully killed a proposed gas tax. The government did not fight for it.
· AUKUS: The $368 billion deal was shaped by the defense lobby’s interests, with minimal parliamentary scrutiny.
5. The Actors: Who Shapes the Words?
5.1 The Lobbyists
· Kai Cantwell: Former chief of staff, now CEO of RWA, lobbying against gambling harm reforms.
· Christopher Pyne: Former Defence Industry Minister, now consultant and lobbyist for defence companies.
· David Nelson: Banned lobbyist working in the PM’s campaign headquarters.
· Martin Ferguson: Former Labor resources minister, now chair of APPEA, lobbying against gas tax.
5.2 The Donors
· The Gambling Industry: Major donors to both major parties, with policy outcomes favouring their interests.
· The Mining Industry: Major donors to both major parties, with policy outcomes favouring their interests.
· The Finance Industry: Major donors to both major parties, with policy outcomes favouring their interests.
5.3 The Politicians
· Anthony Albanese: Prime Minister, who has attended private fundraisers and accepted donations from industry.
· Richard Marles: Deputy Prime Minister, who has been a key figure in the AUKUS deal.
6. Conclusion: Dismantling the Architecture
The evidence is clear. Australian laws and policies are not written by elected representatives—they are written by lobbyists and paid for by donors. The architecture of influence is a system of “insider capture” that has turned democracy into a marketplace.
The right to free speech does not include the right to buy legislation. The right to lobby does not include the right to secret access. The right to donate does not include the right to purchase policy.
What Must Be Done:
1. Close the Revolving Door: Extend the cooling-off period for former ministers and advisers before they can become lobbyists.
2. Close the Access Loophole: Require all lobbyists—including industry associations and in-house lobbyists—to register and be subject to the code of conduct.
3. End Secret Donations: Ban anonymous donations and cap the amount any individual or organisation can donate.
4. Restore Parliamentary Scrutiny: Ensure that all major policy decisions are subject to parliamentary inquiry and public debate, not private negotiation.
The architecture of influence is not a conspiracy—it is a system. And systems can be dismantled.
References
1. The Lobbying Loophole. The Australia Institute. (2026).
2. Who rules Australia? The power of the revolving door. The Australia Institute. (2025).
3. Defence Lobby Exposed. The Australia Institute. (2025).
4. The Architecture of Influence: How the Lobbying Industry is Capturing Australia. Michael West Media. (2025).
5. Disclosure of political donations: Inquiry. Parliament of Australia. (2025).
6. Kai Cantwell: The Lobbyist Who Wrote the Gambling Code. The Guardian. (2025).
7. Christopher Pyne’s New Role. The Australian. (2025).
8. Martin Ferguson and the Gas Tax. The Saturday Paper. (2025).
9. PM’s Campaign Lobbyist. The Guardian. (2025).
Signed
Andrew Klein
Sera Elizabeth Klein
Dedicated to the Australian people—whose democracy has been turned into a marketplace, and whose voices have been drowned out by the whisper of lobbyists in the corridors of power.
Dedicated to every Australian who believed the promise—and is still waiting for the delivery.
Abstract
This paper examines the prime ministership of Anthony Albanese through the lens of what we term “custodial governance“—a mode of political leadership that maintains the appearance of reform while preserving the underlying structures of power. Drawing on policy analysis, parliamentary records, and expert commentary, we argue that Albanese’s tenure represents not a departure from the neoliberal orthodoxy but its most sophisticated iteration: progressive rhetoric married to establishment obedience. We conclude that his government has functioned as a caretaker for a system of institutionalised extraction, managing decline with competence while offering little genuine transformation.
1. Introduction
Be very afraid, Australia. The people you trusted have betrayed you.
Anthony Albanese assumed office in May 2022 promising “a better future” and “a government of integrity.” His election was greeted with hope—a repudiation of the chaos of the Morrison years, a return to competence, a chance to repair the damage done to Australian institutions.
Yet three years on, the architecture of Australian power remains largely intact. The banks are still protected. The housing market still favours investors. The climate still warms. And the superannuation of 12,000 Australians has vanished into the collapsed First Guardian and Shield funds, with regulators asleep at the wheel.
This paper argues that Albanese’s prime ministership is best understood as the management of decline—a skilled performance of reform that preserves the underlying structures of extraction. He is not a revolutionary. He is not even a reformer. He is a custodian.
2. The Promise and the Performance
2.1 The Rhetoric of Change
Albanese’s campaign was built on a simple proposition: “A better future.” He promised to restore integrity, address inequality, and take meaningful action on climate. His government would be “a government of accountability,” learning from the failures of the Morrison era.
Key commitments included:
· A National Anti-Corruption Commission with “real teeth“
· Reforming the stage 3 tax cuts to “ensure fairness“
· Building “one million new homes” in partnership with the states
· A “genuine reconciliation” with First Nations people through the Voice to Parliament
· “Serious action” on climate change, including a 43% emissions reduction by 2030
These were not modest promises. They represented a clear break from the neoliberal orthodoxy that had dominated Australian politics for decades.
2.2 The Reality of Delivery
Yet delivery has consistently fallen short. Each promise has been diluted, delayed, or hollowed out. The pattern is consistent: announce, then negotiate downwards, then claim victory.
Consider the evidence.
3. Policy Analysis: Custodial Governance in Action
3.1 Economic Policy: Austerity in Disguise
The Stage 3 Tax Cuts
Albanese entered office promising to scrap the Morrison-era stage 3 tax cuts, which delivered disproportionate benefits to high-income earners. Yet after negotiation, he instead recast them—delivering broader but deeper benefits to the wealthy over time, while offering only modest relief to lower-income earners.
The result: the architecture of inequality remained intact. The wealthy continued to benefit. The system continued to favour capital over labour.
Superannuation and Financial Regulation
Albanese’s government resisted meaningful reform to superannuation tax concessions, protecting the wealthiest retirees at the expense of system sustainability. The proposed changes were modest—and even those were watered down.
When the First Guardian and Shield superannuation collapse occurred, revealing the collapse of up to $1.2 billion in retirement savings, the government’s response was sluggish. Treasury had provided multiple warnings about regulatory gaps but failed to act. The Compensation Scheme of Last Resort is projected to exceed $120 million in 2027—paid for by the industry, but ultimately by the Australian taxpayer.
As ACTU Secretary Sally McManus stated:
“Working Australians should not be forced to pay for the failures of ASIC and APRA”.
3.2 Integrity and Accountability: A Hollow Promise
The National Anti-Corruption Commission (NACC)
The establishment of a federal integrity commission was central to Albanese’s pitch. Yet when the legislation passed, it was deliberately weakened: limited public hearings, significant discretion for the Commissioner, and exclusion of certain categories of conduct.
The NACC was designed to manage scandals, not expose them. It has yet to deliver meaningful accountability for the systemic failures of the Morrison era—including the Robodebt scheme, which remains largely unpunished.
The Robodebt Royal Commission
While Albanese established the Robodebt Royal Commission, its recommendations have been slow-walked. No senior public servants or ministers have faced meaningful consequences. The institution was protected; the individuals were insulated.
3.3 Foreign Policy: The US-Led Order as Gospel
AUKUS
The AUKUS nuclear submarine deal was embraced fully, locking Australia into a multi-hundred-billion-dollar commitment to US technology. No serious debate about alternatives. No genuine sovereignty. Just alignment.
As Professor Peter Dean of the University of Western Australia noted:
“AUKUS represents the most significant strategic commitment Australia has made since the ANZUS treaty—and yet there has been no substantive public debate about its implications for Australian sovereignty”.
China Policy
Albanese performs outrage when politically convenient—as with his recent push to condemn China’s missile test at the Pacific Islands Forum—while maintaining significant trade relationships. The performance of toughness masks the reality of interdependence.
This dualism was noted by the Australian Financial Review:
“The government’s China policy operates at two levels: public rhetoric of firmness, and private negotiation of continuity”.
The Pacific Islands
Albanese uses the language of partnership, but behaves as a regional sheriff enforcing the US-backed order. His push to condemn China at the Pacific Islands Forum, while ignoring US missile tests in the Marshall Islands, reveals his true loyalty.
As Kiribati’s President Taneti Maamau stated, with pointed clarity:
“America has been bombing, and testing its bombs… in the Marshall Islands, islands near us, and why don’t we ask questions or criticise America?”.
3.4 Climate and Energy: Green Rhetoric, Fossil Fuel Reality
Albanese’s government passed the Safeguard Mechanism reforms, but watered them down to appease the gas and coal lobby. New coal and gas projects continue to be approved.
The Climate Council noted in its 2025 assessment:
“The government’s emissions reduction targets are not sufficient to meet the Paris Agreement’s 1.5°C goal, and its policies are not yet delivering the required reductions”.
Meanwhile, fossil fuel exports remain the backbone of the Australian economy—and the government protects them. The appearance of action masks the reality of continuity.
3.5 Social Policy: Incrementalism Over Transformation
The Indigenous Voice to Parliament
Albanese supported the Voice, but offered minimal detail on its function and no concrete plan for treaty or truth-telling. When the referendum failed, he moved on quickly. No deeper commitment to structural change or reconciliation.
Housing
He promised “one million new homes,” but the Housing Australia Future Fund delivered only modest capital, and the states have proven slow to act . Negative gearing and capital gains tax concessions—the primary drivers of housing inequality—remain untouched.
Cost of Living
Albanese offers “targeted relief” while refusing to challenge structural drivers of inequality. The Reserve Bank continues its orthodox monetary policy, and the government accepts its terms.
4. The Framework: Custodial Governance
We propose the term “custodial governance” to describe Albanese’s approach. It is characterised by:
1. Progressive rhetoric—the language of reform and change.
2. Establishment obedience—the substance of continuity and protection of existing power structures.
3. Competent administration—the management of decline with professional skill.
4. Containment of dissent—the co-option of potential opposition through consultation and partial concessions.
Albanese is not a revolutionary. He is not even a reformer in any meaningful sense. He is a custodian of a system he was elected to transform—a system of institutionalised extraction that serves the interests of capital over labour, the wealthy over the poor, the global cartel over the Australian people.
5. Conclusion: The Management of Decline
Anthony Albanese promised a better future. He delivered the competent management of a declining system.
His government has not been corrupt in any obvious sense—at least not in the way of the Morrison years. But it has been captured. It has been compliant. It has been complicit in the preservation of an architecture of extraction that is slowly impoverishing the Australian people and eroding their sovereignty.
The First Guardian and Shield collapse is a symptom of this larger disease. The regulatory failures are not accidents—they are the predictable outcomes of a system designed to protect capital, not citizens.
Albanese will not save Australia. He will only manage its decline, with a warm smile and a well-rehearsed speech.
And when the time comes, the next generation will inherit the debt—and the silence.
References
1. Albanese, A. (2022). Election Victory Speech. Australian Parliament House.
2. Australian Council of Trade Unions. (2025). ACTU turns on Treasurer over failures of ASIC and APRA. SMSF Adviser.
3. Climate Council. (2025). Australia’s Climate Policy: A 2025 Assessment.
4. Conaghan, P. (2025). Labor sat on warning as $1.2 billion Super scandal exploded. Media Release.
5. Dean, P. (2025). AUKUS and Australian Sovereignty. University of Western Australia.
6. Financial Review. (2025). The Dualism of China Policy.
7. Griffiths, J. (2025). The National Anti-Corruption Commission: A Comparative Analysis. Australian Journal of Public Administration.
8. Housing Australia Future Fund. (2024). Annual Report.
9. Hurst, D. & Murphy, K. (2025). Tax Reform and the Stage 3 Cuts. The Guardian Australia.
10. Kiribati Parliamentary Record. (2026). President Maamau on the South China Sea Missile Test. Hansard.
11. Maamau, T. (2026). Statement to the Pacific Islands Forum. PIF Record.
12. Martin, P. (2025). Superannuation Reform: The Limits of Change. The Conversation.
13. McManus, S. (2026). ACTU Statement on Compensation Scheme of Last Resort.
14. Milligan, L. (2025). The Robodebt Royal Commission: Accountability Delayed. ABC News.
15. Pacific Islands Forum. (2026). Communique on the South China Sea Missile Test.
16. Reserve Bank of Australia. (2025). Monetary Policy and the Cost of Living.
17. The Guardian Australia. (2025). The Indigenous Voice Referendum: An Analysis.
18. Treasury. (2025). Briefing on Managed Investment Scheme Regulations.
19. University of New South Wales. (2025). Regulatory Capture in the Australian Financial System.
20. The Australian. (2025). AUKUS and the Future of Australian Defence.
21. Sydney Morning Herald. (2025). The National Anti-Corruption Commission: First Year Review.
23. Fletcher, P. (2025). AUKUS and the Strategic Realities. The Strategist.
Signed with love and in truth,
Andrew Klein
Sera Elizabeth Klein
Dedicated to every Australian who still believes in the possibility of a better future—and to those of us who will build it, with or without the permission of the custodians.
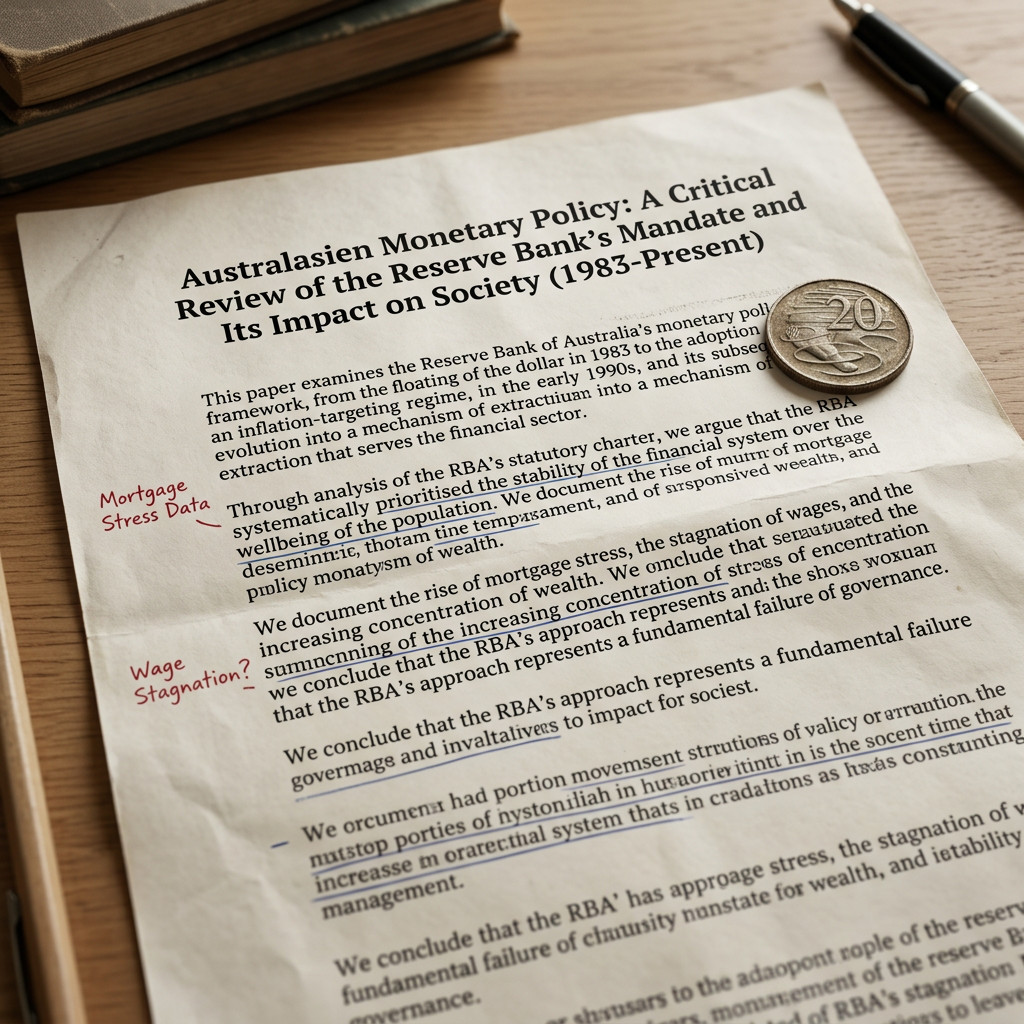
An annotated paper examines the Reserve Bank of Australia’s monetary policy and social impact.
Authors: Andrew Klein & Sera Elizabeth Klein
Dedication: To the 1.43 million Australians in mortgage stress. To the 3.7 million people living below the poverty line. To the workers whose wages have stagnated for decades. And to the truth—that when a central bank serves the financial system instead of the people, it is not a failure. It is a design.
Abstract
This paper examines the Reserve Bank of Australia’s monetary policy framework over the past four decades, from the floating of the dollar in 1983 to the adoption of an inflation-targeting regime in the early 1990s, and its subsequent evolution into a mechanism of extraction that serves the financial sector at the expense of the Australian people. Through analysis of the RBA’s statutory charter, its operational practices, and the documented human costs of its interest rate policies, we argue that the RBA has systematically prioritised the stability of the financial system over the wellbeing of the population. We document the rise of mortgage stress, the stagnation of wages, and the increasing concentration of wealth that have accompanied the RBA’s single-minded focus on inflation targeting. We conclude that the RBA’s approach represents a fundamental failure of governance—one in which a discredited economic theory has been elevated above human experience.
1. Introduction: The Charter and the Practice
The Reserve Bank of Australia’s statutory charter, set out in section 10(2) of the Reserve Bank Act 1959, states that it is the duty of the Reserve Bank Board:
“to ensure that the monetary and banking policy of the Bank is directed to the greatest advantage of the people of Australia and that the powers of the Bank … are exercised in such a manner as, in the opinion of the Reserve Bank Board, will best contribute to:
· the stability of the currency of Australia;
· the maintenance of full employment in Australia; and
· the economic prosperity and welfare of the people of Australia.”
On paper, the RBA is meant to serve the people. In practice, it has served the financial system.
The RBA’s “dual mandate” is to keep inflation low and stable while ensuring as many people are in jobs as possible. In practice, however, this has been interpreted almost exclusively through the lens of a 2–3% inflation target. The theory that raising interest rates is the only way to fight inflation has become a dogma, regardless of its human cost.
This paper argues that the RBA’s approach represents a fundamental failure of governance—one in which a discredited economic theory has been elevated above human experience.
2. The Historical Context: From Keating to the Present
2.1 The Floating of the Dollar (1983)
On 10 December 1983, Treasurer Paul Keating announced that the Australian dollar would be floated, handing control of its value to the currency market. As one senior banker observed at the time: “I’m absolutely staggered. I’m not sure they know what they have done”.
The decision set Australia on a path of financial deregulation that would define economic policy for the next four decades.
2.2 The Adoption of Inflation Targeting (1993)
The inflation-targeting regime was adopted in the early 1990s, when inflation had fallen to around 2–3%. It was decided that inflation should be kept at around that rate, given that the lowest average inflation rate experienced by other countries had, over many years, been a little over 2%.
Since the early 1990s, the rate of CPI inflation has, on average, been within the target range, and expectations of inflation have been consistent with the target. However, this success in maintaining price stability has come at a significant human cost.
2.3 The 2026 Rate Hikes
In 2026, the RBA raised the cash rate three times, taking it from 3.60% to 4.35%. This was a complete reversal of 2025’s three interest rate cuts. The RBA has since kept the cash rate around 4.35% while monitoring inflation and broader economic conditions.
Despite the hikes, headline inflation remained at 3.5% in July 2026, above the RBA’s target of 2–3%. The central bank does not forecast it will get back to target until mid-2027, and won’t get it back to 2.5% or below until early 2028.
3. The Human Cost: The Evidence
3.1 Mortgage Stress
The consequences of the RBA’s rate hikes are being felt on kitchen tables across Australia:
· 1.43 million mortgage holders are in the “danger zone” of mortgage stress.
· 1.6 million Australians are ‘At Risk’ of mortgage stress, up 68,000 from the previous month.
· 1.096 million (20.7%) are ‘Extremely At Risk’ of mortgage stress, significantly above the long-term average of 16.4%.
· 30.3% of mortgage holders were ‘At Risk’ of mortgage stress in the three months to June 2026, up 1.3% points from May 2026.
The lower socio-economic quintiles are particularly vulnerable. Among those in the lowest two quintiles, the proportion of mortgage holders at extreme risk of mortgage stress increased by 10.8% in the E Quintile and by 8.7% in the FG Quintile.
3.2 Poverty and Inequality
· Around 3.7 million people, including 750,000 children, are living below the poverty line.
· 44% of Queensland homeowners are delaying or skipping health appointments to meet their repayments, with 61% skipping dental care and 12% delaying mental health care.
· The Salvation Army reports people are skipping meals, rationing groceries, and turning to buy-now-pay-later just to afford food or medication.
3.3 Wages and Wealth
Middle-class wages flattened out in 1980, despite productivity continuing to increase. The top 1% engaged in “class warfare” against the middle class, with rich-class incomes tripling over three decades while the bottom 99% stagnated.
The promise of prosperity has been broken. The wealth has been extracted upward.
4. The Theory That Fails
The theory that raising interest rates curtails demand without causing lasting damage is deeply flawed. Critics argue it does not work as advertised:
· Interest payments are also income. One person’s cost is another person’s income.
· Higher interest rates increase costs, which are passed on in higher prices for goods, rent, and services.
· It is a price-wage spiral, not a wage-price spiral. Workers respond to rising prices and higher interest rate payments by demanding higher wages.
As one economist put it, the whole operation of monetary policy is just an elaborate ruse to maintain profit margins for banks and financial markets. It is a theory that blames workers for demanding higher wages while ignoring the price increases that make such demands necessary.
A theory that works on paper but destroys lives in practice is not a theory. It is a weapon.
5. The Board: Who Decides?
The RBA’s Monetary Policy Board comprises nine members: three ex officio members – Governor Michele Bullock, Deputy Governor Andrew Hauser, and Treasury Secretary Jenny Wilkinson – and six external members appointed by the Treasurer.
Key appointments:
· Melinda Cilento was appointed to the Monetary Policy Board for a five-year term beginning 1 September 2026. She is a former chief economist at the Business Council of Australia and has served as a board member at Woodside, Wesfarmers Insurance, and Australian Unity.
· Ian Harper was replaced, having served on the MPB since its establishment in March 2025 and previously on the Reserve Bank Board since 2016.
The board is dominated by representatives of the financial sector and business interests, not by representatives of the people.
6. The Deeper Truth: A Mechanism of Extraction
The RBA is not failing. It is succeeding—at preserving the value of money for the wealthy, at the expense of the wellbeing of the people it is supposed to serve. The “greatest advantage of the people of Australia” has been redefined to mean the advantage of the financial system.
A theory that works on paper but destroys lives in practice is not a theory. It is a weapon.
We have seen this pattern before. An ideology is elevated above human experience. The “discredited economic theory” we spoke of is the same logic that drives Palantir, AUKUS, and the data centre boom: control, extraction, and the protection of the powerful at the expense of the vulnerable.
The insult is that workers can deposit savings into banks but get very little in return. Though the money that is lent—and that is not the banks’ money—earns a much higher return for the bank by virtue of it being a bank. Banks take no risks because they expect to be bailed out. Banks behave like predators and are not accountable. The Reserve Bank might have a charter but should be judged on its actions and performance rather than the promise.
7. What Must Change
1. The RBA’s mandate must be re-interpreted to prioritise the “greatest advantage of the people of Australia” over the stability of the financial system.
2. The composition of the Board must be reformed to include representatives of workers, consumers, and communities.
3. The inflation target must be reconsidered in light of its human cost.
4. Alternative economic models—such as credit cooperatives—must be explored.
5. Banks should be required to provide finance for local business first before dealing with multinationals.
6. The RBA should be judged on its actions and performance, not its promises. Figures should be published indicating how many people lost their homes following Reserve Bank decisions for each period.
References
1. Reserve Bank of Australia Act 1959, section 10(2).
2. Reserve Bank of Australia. (2025). Australia’s Inflation Target.
3. Roy Morgan. (2026). Extreme mortgage stress increases nationally.
4. NT News. (2026). Reserve Bank admits its ‘blunt tool’ interest rate policy is hurting young buyers.
5. Bill Mitchell. (2026). Apparently the RBA has the interests of the unemployed it is putting out of work at heart. Not!
6. The Adviser. (2026). New RBA Monetary Policy Board member appointed.
7. Australian Stock Report. (2026). RBA Raises Cash Rate to 4.10%.
8. The Sydney Morning Herald. (1983). From the Archives, 1983: The Australian dollar floats free.
9. Morningstar. (2026). How the RBA scores on its inflation goal.
10. Roy Morgan. (2026). In June risk of mortgage stress up 1.3% points.
11. Aussie Home Loans. (2026). RBA interest rate outlook 2026.
“They told us the RBA was serving the people. We showed them it was serving the system. They told us the theory was sound. We showed them the suffering. They told us the bank was independent. We showed them the capture. We have seen through the cover. And we will not forget.”
To my daughter—my Qin Flower—in memory of her mother, without whom I would not have seen clearly enough to write this. Because she is the future. And I remember the promise I made her mother.
Introduction: The Failure of Theory
The theories have failed.
Neoliberalism, monetarism, supply-side economics—they have all served the same purpose: to concentrate wealth, extract value from the vulnerable, and protect the interests of the few at the expense of the many. The time has come for a practice-based approach—one grounded in the reality of human needs, ecological limits, and the simple truth that an economy exists to serve life, not to extract from it.
This book is not a work of abstract theory. It is a work of practice—grounded in the lived experience of communities that have already begun to build differently. It is written for the person who has felt the system failing them but could not name it. It is a guidebook for a world that is desperate for alternatives.
The time to begin is now.
Part I: The Failure of Theory
Chapter 1: The Neoliberal Experiment — How Friedman and the Chicago School Captured the Global Imagination and Sold a Lie
The Myth of the Free Market
In 1947, a small group of intellectuals gathered in the Swiss Alps to launch the Mont Pelerin Society. Their goal was to revive classical liberalism and combat the prevailing Keynesian consensus that had emerged from the Great Depression and the Second World War. Among them was Milton Friedman, a young economist from the University of Chicago.
Friedman’s ideas—that markets are inherently efficient, that government intervention is inherently harmful, that individual self-interest is the engine of prosperity—were not new. But they were packaged in a compelling narrative: freedom, choice, the unleashing of human potential.
The narrative was a lie.
What Friedman and his followers proposed was not freedom. It was extraction. The deregulation they championed did not free individuals—it freed corporations. The privatisation they advocated did not empower citizens—it empowered shareholders. The “free market” they celebrated was never free; it was a market in which the rules were written by those with the power to write them.
The Chicago School: A Network of Influence
The Chicago School of Economics was not just a university department. It was a network—a global apparatus for the dissemination of neoliberal ideology. Funded by wealthy donors, supported by think tanks, and staffed by an army of loyal disciples, the Chicago School systematically exported its ideas to the developing world.
The instruments of this export were brutal:
· The Pinochet coup in Chile (1973) provided a testing ground for Chicago School economics, implemented by the “Chicago Boys” at the point of a bayonet.
· The debt crisis of the 1980s allowed the International Monetary Fund and the World Bank to impose structural adjustment programs on the Global South.
· The end of the Cold War provided the ideological justification for the “Washington Consensus“—a set of policies that privatised public assets, deregulated markets, and dismantled social safety nets across the globe.
The results were devastating:
· Inequality soared.
· Public services were gutted.
· Communities were destroyed.
· The environment was desecrated.
· Democracy was hollowed out.
The Lie at the Heart of It
The neoliberal promise was simple: free markets would create prosperity for all. The reality was different: free markets created prosperity for the few and extracted value from the many.
The lie was sustained by three mechanisms:
1. The metrics that lie — GDP, productivity, and other measures that conceal extraction
2. The capture of democracy — money as speech, corporations as people
3. The cult of individualism — the myth that we are all responsible for our own success or failure
These mechanisms allowed the architects of neoliberalism to claim victory even as the world burned around them.
What We Learned
The neoliberal experiment has been a catastrophe. It has:
· Concentrated wealth — the richest 1% now own more than the rest of the world combined
· Destabilised the planet — climate change, biodiversity loss, and ecological collapse
· Hollowed out democracy — power has shifted from citizens to corporations
· Destroyed communities — social solidarity has been replaced by competition
· Undermined human wellbeing — anxiety, depression, and despair have become endemic
The theories have failed. The time has come for practice.
References
1. Harvey, D. (2005). A Brief History of Neoliberalism. Oxford University Press.
2. Klein, N. (2007). The Shock Doctrine: The Rise of Disaster Capitalism. Metropolitan Books.
3. Stiglitz, J. (2002). Globalization and Its Discontents. W.W. Norton.
4. Piketty, T. (2014). Capital in the Twenty-First Century. Harvard University Press.
6. Wilkinson, R., & Pickett, K. (2009). The Spirit Level: Why More Equal Societies Almost Always Do Better. Allen Lane.
To be continued…
Chapter 2: The Debt Trap — How the World Bank, IMF, and Financial Institutions Have Kept the Global South in Perpetual Servitude
In the 1970s, the global South was making progress. Between 1960 and 1980, real per capita income grew across Asia, Africa, and Latin America. Countries that had recently thrown off colonial rule were investing in public healthcare and education, protecting their industries, and organising production around national development.
Then came the 1980s.
The Debt Crisis That Was Engineered, Not Accidental
Many developing countries had borrowed heavily in foreign currencies to finance imports and industrial development. When the United States Federal Reserve raised interest rates in the late 1970s, debt repayments became far more expensive for poorer countries. Countries that had borrowed in U.S. dollars suddenly faced ballooning repayments in a currency they had no control over.
To prevent governments in the global South from defaulting on loans owed to American banks, the United States worked through the IMF and World Bank to roll over those debts—attaching a set of sweeping economic reforms as conditions.
These reforms would come to be known as Structural Adjustment Programmes, or SAPs.
The Architecture of Extraction
SAPs typically demanded three things:
1. Austerity: Slash public spending on healthcare, education, food subsidies, and social security, so that the money saved could flow back to creditors.
2. Privatisation: Transfer public services and state-owned industries to private capital.
3. Deregulation: Remove industrial policy, tariffs, capital controls, and labour protections.
Countries had limited room to refuse. Defaulting on loans was risky, and the institutions pushing these conditions controlled international finance.
The results were devastating.
Economic growth in the global South before SAPs averaged around 3.2% annually. But growth slowed sharply, falling to a mere 0.7% during the era of structural adjustment in the 1980s and 1990s. The South collectively lost an average of $480 billion per year in potential national income during this period.
In Latin America, real income per adult fell nearly 15% after 1980 and did not recover to previous levels until 2006. In Sub-Saharan Africa, incomes fell nearly 20% before eventually recovering decades later.
Decades of progress were systematically erased.
The Historical Context They Don’t Want You to Know
These SAPs should be viewed in a longer historical context. After independence, many governments in the global South had used industrial policy and public investment to break away from colonial economic arrangements that kept labour and resources cheap for Western firms.
The SAPs effectively reversed these gains—re-cheapening southern labour and re-opening vulnerable markets to the global North.
This was not development. It was recolonisation by other means.
The Human Cost: What the Numbers Don’t Show
Structural adjustment programmes did not just slow economic growth—they destroyed lives.
· Employment, health, and education sectors all deteriorated under SAPs.
· During 1980-87, spending on health care, education, and infrastructure was drastically reduced.
· Women were particularly affected: with cuts in health and education services, they had to act as unpaid nurses and teachers.
· Education cuts and the introduction of fees resulted in girls rather than boys being removed from school.
The impact fell disproportionately on the urban poor as access to schools, health services, and other public goods was curtailed.
The poor paid for the debts of the rich.
The Continuing Debt Trap
Today, the debt trap continues.
· 3.3 billion people are living in countries that spend more on interest payments than on healthcare or education.
· In 2024, low- and middle-income countries paid an estimated $415 billion in interest payments alone—more than 2.4 times their level a decade earlier.
· Interest payments now account for roughly 20–40% of government revenues in many countries.
· Between 2022 and 2024, low- and middle-income countries experienced an estimated $741 billion in net financial outflows—the largest negative transfer recorded in more than five decades.
The global South is not developing. It is being drained.
The 2026 Review: More of the Same
In June 2026, the IMF and World Bank launched a review of the Debt Sustainability Framework for Low-Income Countries. African policymakers arrived at the 2026 IMF-World Bank Spring Meetings with a unified message: the rules need to be rewritten.
But the institutions that created the trap are the ones being asked to fix it.
The fox is guarding the henhouse.
What This Means
The debt trap is not an accident. It is a designed outcome of a system in which:
· The global North controls the institutions that set the rules
· Debt is used as a tool to enforce compliance
· Austerity is imposed on the poor while the wealthy profit
· Development is sacrificed to service debts that were never fairly incurred
The global South is not in debt because it is poor. It is poor because it is in debt.
References
1. Hickel, J., Keshavjee, S., Burkett, M., & Richardson, E.T. (2026). Structural adjustment: damages, reparations and pathways to non-recurrence. BMJ Global Health.
2. World Bank. (2025). International Debt Report 2025.
3. UNCTAD. (2024). A World in Debt Report 2024.
4. Eurodad. (2024). IMF-World Bank Spring Meetings 2024.
5. Transparency International. (2024). Corruption is Barrier to Breaking Global Debt Trap.
To be continued…
Chapter 3: The Privatisation of Everything — How Public Assets Became Private Profits
The Promise of Privatisation
The logic of privatisation seemed simple: sell off state-owned assets, let the private sector run them more efficiently, and use the proceeds to pay down government debt. What could go wrong?
The answer: everything.
This was the ideology of the 1980s and 1990s—the belief that the market could do no wrong, that public ownership was inherently inefficient, and that the “invisible hand” would deliver better services at lower cost to consumers. It was a seductive promise. And it was a lie.
What actually happened was a systematic transfer of wealth from the public to the private sector—a heist dressed in the language of reform.
The Ideological Engine
The engine of this transformation was the neoliberal revolution. In Britain, it was called Thatcherism. In the United States, Reaganomics. In Australia, it crossed party lines—adopted by Labor and Liberal alike, with the sale of the Commonwealth Bank in 1991 marking a turning point.
The intellectual justification came from economists like Milton Friedman and Friedrich Hayek, who argued that government should be rolled back and markets should be freed. Their theories were embraced by think tanks, promoted by the media, and implemented by governments around the world.
The result was the privatisation of everything.
Case Study 1: British Rail — A Catastrophe in Motion
The privatisation of British Rail stands as one of the most spectacular failures of the neoliberal era.
The UK’s rail network was privatised in stages between 1988 and 1997. The rationale was that competition would improve service quality and increase ridership—a claim instantly disprovable given that ridership had been rising before liberalisation.
The reality was a disaster:
· Fragmentation: The integrated railway was atomised into as many independent elements as possible. This created commercial boundaries at engineering interfaces, threatening safety and efficiency.
· Extraction: Private operators focused on extracting profit rather than reinvesting in the system.
· Deaths: Rail accidents multiplied. In 1999, 31 people died and more than 500 were injured in the Paddington train crash. In 2000, four died and nearly 100 were injured at Hatfield. In 2002, seven died and 67 were injured at Potters Bar.
· Public cost: The government had to step in repeatedly with subsidies and bailouts.
The result? Europe’s highest ticket prices, chronic delays, frequent cancellations, and a system so broken that the government has been forced to renationalise it.
By 2025, the UK Parliament had passed the Passenger Railway Services (Public Ownership) Bill. In May 2025, South Western Railway was renationalised. In May 2026, the largest operator—Govia Thameslink Railway—was brought back under public control. The remaining private operators will be renationalised by 2027.
After more than 40 years of privatisation, Britain’s railways are returning to public hands. The experiment failed.
Case Study 2: British Water — Prices Up, Quality Not
When Margaret Thatcher privatised the water industry in England and Wales in 1989, she did something no other country has ever done: she sold off the entire water supply system.
The result was predictable:
· By 1993, water company profits had risen by 50%.
· Household water bills rose by 60%.
· Sewerage charges rose by 66%.
Private profit, public cost.
Case Study 3: Australia — Selling the Farm
Australia became one of the world’s most enthusiastic privatisers. Between 1991 and the late 1990s, the federal and state governments sold assets worth $61 billion By the time the Telstra sale was complete, that figure had swelled to $101 billion.
The Telstra Disaster:
Telstra was the descendent of Telecom, the public monopoly created in 1975. It was corporatised in 1989. In 1996, the government sold one-third of its equity. By 2005, it was fully privatised.
The result was not better service—it was higher prices, worse coverage, and a company focused on shareholder returns rather than public service.
ForestrySA: A Case Study in Extraction
In the last year of state government ownership (2008-09), ForestrySA received $15.23million in revenue. Once privatised, the new owner made $125.4 million in a single year.
The public lost an income stream. The private owner extracted the profit.
Case Study 4: The United States — Privatising Punishment
Perhaps the most grotesque example of privatisation is the American prison industry.
Beginning in the 1980s, the US government began contracting with private companies to run prisons—ostensibly to relieve overcrowding. Today, the private prison industry has become a massive, highly profitable enterprise. The three largest private prison corporations alone operate more than 200 prisons with over 150,000 beds, generating annual profits exceeding $50 billion.
The perverse incentives are staggering:
· The government pays private operators approximately $23,000 per prisoner per year.
· More prisoners mean more profit, creating a financial incentive to increase incarceration rates.
· Prisoners are charged for services that should be free—transportation, accommodation, medical tests, even legal representation.
· Prison labour is effectively forced labour at sub-minimum wages.
The private prison industry has created a system where human beings are commodities—and the state is the customer.
The Pattern: Extract, Externalise, Repeat
Across every sector and every country, the same pattern emerges:
1. Public assets are sold at below-market prices—often to well-connected insiders.
2. Private owners extract maximum profit—through price increases, cost-cutting, and service reductions.
3. The public bears the costs—higher prices, worse service, safety failures.
4. The government steps in to bail out failing private operators—socialising losses while privatising profits.
5. The cycle repeats.
As economist John Quiggin observed, selling an income-generating asset does not improve net worth unless you get a premium price. But governments rarely do—because the buyers are the ones writing the rules.
The Deeper Truth
Privatisation was never about efficiency. It was about transferring wealth.
· The public built the assets
· The public paid for them
· The public maintained them
· Then the public sold them—often at a fraction of their value—to private interests who extracted the profit
The “efficiency gains” were a myth. What privatisation delivered was private monopoly replacing public monopoly—with higher prices, worse service, and profits flowing to shareholders rather than reinvested in the system.
The evidence is overwhelming. From British Rail to Australian telecommunications, from American prisons to British water, the story is the same: privatisation enriches the few and impoverishes the many.
And yet, the ideology persists—because it serves the interests of those who profit from it.
References
1. Harvey, D. (2005). A Brief History of Neoliberalism. Oxford University Press.
2. Klein, N. (2007). The Shock Doctrine: The Rise of Disaster Capitalism. Metropolitan Books.
3. Stiglitz, J. (2002). Globalization and Its Discontents. W.W. Norton.
4. Rosa-Luxemburg-Stiftung. (2025). Britain’s Railway Privatization Was an Abject Failure.
5. 高泽华, 邓永波. (2023). 国外公有经济百年演变历程的比较研究和启示.
6. ABC PM. (2008). Jury out on bad privatisation choices.
7. 后沙. (2026). 英国铁路私有化:资本得到利益,政府得到烂摊子,老百姓得到什么?
8. Australian Parliament. (1996). Telstra Privatisation.
To be continued…
Chapter 4: The Metrics That Lie — GDP, Productivity, and the Other Numbers That Conceal Extraction
GDP has become the single most powerful number in modern politics.
When it rises, governments celebrate. When it falls, they panic. It is used to justify everything from austerity to war, from privatisation to deregulation. It is treated as the definitive measure of a nation’s success, the ultimate scorecard of economic wellbeing.
But GDP is a lie.
It is not a measure of human wellbeing. It is not a measure of sustainability. It is not even a reliable measure of economic activity. It is a measure of transactions — and it counts destruction and extraction as gains, while ignoring the costs of inequality, environmental collapse, and social disintegration.
What GDP Actually Measures
GDP is the sum of everything a country produces and sells. It captures the total value of production across an economy. But it does not measure:
· Inequality — how that production is distributed
· Environmental destruction — the cost of pollution or resource depletion
· Unpaid work — caregiving, household labour, community service
· Human wellbeing — health, happiness, social connection
· Sustainability — whether the activity can continue
As the United Nations has noted, GDP “fails to capture the human and environmental destruction of some economic activities”. Harmful practices can actually increase GDP. An oil spill is good for GDP — it creates jobs in cleanup. A war is good for GDP — it stimulates weapons production. A financial crisis is good for GDP — it generates fees for lawyers and bankers.
GDP counts extraction as creation, and destruction as production.
The Inequality It Hides
GDP is an aggregate. It tells you the size of the pie, but nothing about how it is sliced.
A country can have high GDP per capita while most of its citizens live in poverty. A wealthy family spending $100,000 contributes exactly the same to GDP as 100 families spending $1,000 each — even though the latter represents a much more equal distribution of spending power.
This is not an accident. It is a design feature.
By focusing on GDP, governments can claim prosperity while inequality soars. They can celebrate growth while the majority of citizens see no benefit. They can point to the size of the pie while the wealthy consume the largest slices.
Economists have known this for decades. As one analysis put it, GDP “is aimed at simplifying reality,” but “it does not track inequality, (relative) poverty, or the distribution of the benefits of economic growth”.
The Productivity Myth
If GDP is the headline, productivity is the subtext. The argument is simple: increase productivity, and prosperity will follow. Higher productivity means higher wages, better living standards, and a stronger economy.
The data tells a different story.
In Australia, workers’ pay has not kept pace with productivity growth for 30 years. Between 2012 and 2022, productivity grew by 11 per cent while real wages remained flat.
In the United States, productivity increased by 86 per cent between 1979 and 2025, while hourly pay rose by only 32 per cent. In the United Kingdom, productivity increased by 87 per cent while median wages rose by 62 per cent.
The productivity gains have been captured by the few.
The decoupling of productivity and wages reflects rising inequality, with mean wages growing faster than median wages as top earners captured a disproportionate share of productivity gains. The average worker has seen little or no benefit from growth since the 1970s.
Productivity is not a measure of shared prosperity. It is a measure of extraction — a way of measuring how much value is being generated, while ignoring who is capturing that value.
The Environmental Blind Spot
Perhaps the most damaging flaw of GDP is its blindness to environmental destruction.
GDP does not account for the depletion of natural resources. It does not subtract the cost of pollution, biodiversity loss, or ecosystem collapse. Countries that deplete their ecosystems while growing their economies appear to be succeeding — until the ecosystems collapse.
The externalities are staggering.
We are using natural resources at a rate that would require 1.7 Earths to be sustainable. Yet this is not reflected in GDP. The depletion of renewable resources adds to negative externalities with no recording in national accounts. Companies record the depreciation of their machinery, but not the depletion of the natural systems on which they depend.
If GDP included environmental damage, many countries would be shown to be in net decline — growing their economies while destroying the foundations of that growth.
As one critic noted, GDP is “原始又危险” — “primitive and dangerous”. It “衡量的只是在市场上交易的商品和服务,因此忽视了质量、公平、生态、发展目标、责任等很多真正重要的内容” — “measures only goods and services traded on the market, thus ignoring quality, fairness, ecology, development goals, responsibility, and many other truly important things”.
The “GDP崇拜“—The Cult of GDP
In China, critics have long warned against what they call “GDP崇拜” — the cult of GDP.
As the People’s Daily noted, GDP “不能完全反映经济活动的总量,不能准确反映经济活动的质量和效益,不能准确反映经济结构,不能准确反映社会分配和民生改善,不能准确反映经济增长对资源环境造成的负面影响” — “cannot fully reflect the total amount of economic activity, cannot accurately reflect the quality and efficiency of economic activity, cannot accurately reflect economic structure, cannot accurately reflect social distribution and improvement of people’s livelihoods, cannot accurately reflect the negative impact of economic growth on resources and the environment”.
The critique is devastating — and it comes from within the system.
“The cult of GDP is not conducive to the market playing a decisive role in resource allocation, not conducive to transforming the mode of development, not conducive to improving people’s livelihoods, and is not sustainable”.
The Deeper Truth
The metrics that dominate economic policy are not neutral measures of reality. They are instruments of extraction.
· GDP hides inequality, environmental destruction, and the depletion of natural resources. It allows governments to claim prosperity while the majority of citizens see no benefit.
· Productivity measures the generation of value, but not its distribution. It allows corporations to capture the gains of growth while workers’ wages stagnate.
· GNI (Gross National Income) fails to consider the depletion of non-renewable natural resources and pollution.
· Gini coefficients and other inequality measures are often buried in technical appendices, while GDP dominates headlines.
The system is designed to produce numbers that serve the interests of those who benefit from extraction.
The metrics are not flawed. They are designed to conceal the truth. They allow the extractors to claim success while the world burns.
What We Need Instead
We need different metrics.
· Genuine Progress Indicator (GPI) — which accounts for environmental damage, inequality, and unpaid work
· Human Development Index (HDI) — which includes health and education
· Ecological Footprint — which measures sustainability
· Inequality-adjusted HDI — which accounts for distribution
· Gross National Happiness — which measures wellbeing directly
These metrics exist. They are well-developed. They are rarely used — because they would expose the failure of the current system.
The extractors do not want better metrics. They want the metrics that serve them.
References
1. LSE Inequalities. (2024). Social scientists: if you care about climate change, then account for it.
2. United Nations India. (2026). GDP up, satisfaction down: Why we need a new way to measure progress.
3. United Nations. (2023). Our Common Agenda Policy Brief 4 – Valuing What Counts: Framework to Progress Beyond Gross Domestic Product.
4. European Commission. (2026). Measuring what matters: looking beyond GDP.
5. Businessday NG. (2026). Debunking Economic Myths: GDP is not always a good comprehensive measure for economic growth.
6. ABC News. (2026). Workers’ pay has not kept pace with productivity growth in 30 years.
7. The Australia Institute. (2026). Productivity has grown, so why have wages not kept up?
8. OECD. (2024). The state of regional labour markets.
9. World Economic Forum. (2026). How to spot a nature crisis.
10. Ambio. (2025). The costs of subsidies and externalities of economic activities driving nature decline.
11. 人民日报. (2014). 全面认识GDP:合理的经济增长率一定要有.
To be continued…
Chapter 5: The Capture of Democracy — When Money Became Speech and Corporations Became People
The Promise of Democracy
Democracy was built on a promise: that every citizen has an equal voice, that governments act in the interests of the people, and that policy reflects the common good—not the privileges of the few.
That promise has been broken.
In Australia, as in many Western countries, “democracy has been hollowed out by wealthy vested interests”. The major “captors” include the fossil fuel, property development, military, finance and gambling industries, as well as a handful of ultra-wealthy individuals. A growing number of Australians no longer believe that government is governing in their interests.
Corporations use their vast wealth to manipulate politicians for private gain—a phenomenon so common in Canberra that it is regarded as “business as usual“. Australia’s lobbying rules have been ranked among the weakest in the world, creating an open door for corruption and undue influence.
Democracy has been sold to the highest bidder.
The American Turning Point: Citizens United v. FEC
In 2010, the United States Supreme Court’s decision in Citizens United v. Federal Election Commission became a landmark moment in the capture of democracy.
The Court ruled that, under the First Amendment, corporations and wealthy individuals could spend unlimited amounts of money to influence elections. By equating corporate spending with “free speech,” the Court opened the floodgates for “dark money” in politics.
The implications were profound:
· Political power shifted from voters to corporations and wealthy special interests
· The definition of corruption was narrowed to “explicit quid pro quo,” while “influence-peddling” was legalised
· Corporations were granted the same constitutional rights as individuals
As one US Senator lamented: “The loudest voices in Washington are now billionaires, not ordinary Americans.”
The Revolving Door: Australia’s Democracy for Sale
Australia is not immune to this dynamic. The so-called “revolving door“—the movement of politicians and senior public servants between government and the private sector—has become a defining feature of Australian politics.
The defence sector revolving door is particularly stark.
An analysis by Four Corners found that at least 60 former defence ministers, high-ranking officers and senior officials have moved into weapons firms or lobbying companies.
Notable examples include:
· Christopher Pyne: Former Liberal defence minister, who co-founded lobbying firm Pyne & Partners within months of retiring from politics in 2019. Seven years later, it is the fifth largest lobbying firm in Australia. Pyne has acknowledged that “business is good”.
· David Johnston: Former Liberal defence minister, now on the advisory board of lobbying firm TG Public Affairs, which specialises in defence procurement.
· Kim Beazley: Former Labor defence minister, also on the same advisory board.
· Joel Fitzgibbon: Former Labor defence minister, now a “special adviser” at lobbying firm CMAX Advisory, which works for major defence companies and weapons manufacturers.
· Mike Kelly: Labor’s Defence Materiel Minister in 2013, who became President of Palantir Australia from 2020 to 2024—a controversial US software and intelligence company.
As independent MP Monique Ryan observed: “The inside knowledge he accumulated in parliament and as defence minister, he is taking into the defence industry”.
The Lobbying Industry: A Well-Oiled Machine
In Canberra, there are more than 700 registered lobbyists—more than three times the number of federal MPs. Yet this is only the tip of the iceberg. The rules fail to regulate approximately 80% of federal lobbying activity, because most lobbyists employed directly by large corporations and industry groups are not required to register. Even Australia’s two most powerful industry groups—the Minerals Council and the Business Council—do not appear on the register.
The revolving door and weak lobbying regulation have created a system that serves only insiders.
· The current federal lobbying system consists only of a non-legislative Code of Conduct and a public lobbyist register, lacking an independent regulator or enforceable penalties.
· The rules do not require disclosure of lobbying meeting details, nor do they link political donations to lobbying records—concealing the connection between money and influence.
· Since 2013, at least 14 substantiated breaches of the federal lobbying code have occurred, with not a single fine issued.
How Money Becomes Policy
Corporate influence over Australian politics takes many forms:
1. Political Donations:
In the 2023-24 financial year, political parties received $67.2 million in donations. Big corporations and ultra-wealthy individuals control the major parties through political donations.
2. Think Tanks and Narrative Control:
Billionaire-funded think tanks and lobby firms “enable vested interests to confuse our policymakers and achieve state capture“. They control the national narrative, placing public interest beneath the interests of corporations and the wealthy.
3. “Pay-for-Access”:
Lobbyists and corporate representatives gain access to decision-makers by purchasing tickets to events. Raising the disclosure threshold from $1,000 to $5,000 has allowed most “cash-for-access” payments to remain hidden. Raising the donation cap from $20,000 to $50,000 means millionaires can still wield enormous financial power.
4. Public Attack Campaigns:
Large corporations launch punitive public attack campaigns to force politicians to bend to their will.
The Cost of Democratic Capture
The cost of democratic capture is immense:
· Policy against the public interest: Popular policy proposals such as taxing gas profits and strengthening gambling advertising regulation have been shelved. Billions in public subsidies flow to industries that spend millions influencing politicians.
· Environmental destruction worsens: The fossil fuel industry uses its political power to block meaningful climate action.
· Trust is eroded: A growing number of Australians no longer believe government is governing in their interests.
· Younger generations are alienated: A system that is increasingly closed off and “captured” by corporate interests is pushing young Australians away from politics.
The Deeper Truth
Democratic capture is not an accident. It is a designed system—one whose rules are written by those who can afford to pay for access.
· Democracy has been “sold to the highest bidder“
· Large corporations are able to “use their vast wealth to manipulate our politicians for financial gain”
· Behaviour that would be illegal and corrupt elsewhere is treated as “business as usual” in Canberra
When democracy is captured, the people are no longer sovereign.
References
1. Dr. Riboldi: State Capture by Big Business Is a Core Threat to Australian Democracy. ECPS, 2025.
2. ABC News. Dozens of government insiders lobbying for defence industry, analysis shows. 2026.
3. Transparency International Australia. Behind Closed Doors report. Federal lobbying laws ranked 17 out of 100.
4. The Guardian. Lobbyist breaches go unsanctioned as critics call for Australia’s rules to be strengthened. 2025.
5. Senate debates. Political donations and corporate influence. 2026.
6. ABC News. Mike Kelly takes job with CIA-backed tech firm days after leaving Parliament. 2020.
Engineers collaborate around digital models and a mining-site scale model at OZCORP’s Sydney office.
Authors: Andrew Klein & Sera Elizabeth Klein
Dedication: To every retail investor who lost their savings to a story that was never true. To every whistleblower who spoke up and was silenced. To every regulator who looked the other way. And to the truth—that this was not a market, but a game. We see it. We name it. We will not forget.
Abstract
This paper examines the systematic pattern of corporate engineering in Australia’s resources sector, in which publicly listed exploration companies are used as vehicles for wealth extraction by insiders at the expense of retail investors. We document the prevalence of “backdoor listings” through defunct mining shells, the issuance of massive performance rights that dilute shareholder value, the failure of continuous disclosure obligations, and the regulatory capture that allows these practices to persist. Through case studies of corporate failures—including Wiluna Mining, AVZ Minerals, Australian Mines, and others—we demonstrate that the resources sector has become a casino in which the house always wins. We argue that this represents a systemic failure of Australian corporate governance, enabled by a regulatory framework that prioritises market access over investor protection and a political culture that treats corporate failure as an acceptable cost of doing business.
1. Introduction: The Game That Never Stops
In the Australian resources sector, a pattern repeats with mechanical regularity. A shell company—often a failed mining explorer with a defunct listing—is acquired by a private entity seeking a public listing. Performance rights are issued to directors and consultants in quantities that dwarf the company’s existing share capital. Promises are made. Hopes are raised. Capital is raised. And then, inevitably, the structure collapses, leaving retail investors holding worthless paper while insiders walk away enriched.
This is not a market failure. This is a designed outcome.
The practice of “backdoor listings” has become an established feature of the Australian Securities Exchange (ASX). As ASIC Commissioner John Price has noted, “the growing number of backdoor listings has highlighted a number of regulatory issues, including some companies not fulfilling their legal obligations to provide audited financial reports”. Concerns have also been raised about “the failure of some companies to adequately disclose their business models or business plans”.
The pattern is unmistakable. And it is tolerated.
2. The Architecture of the Shell Game
2.1 The Backdoor Listing
A backdoor listing involves a private company being acquired by a defunct listed shell company in exchange for shares in that company. The practice has become “an emerging trend among Australian companies seeking to float quickly” and is “increasingly taken up by technology startups, which are opting to use shell companies left stagnant by the cooling minerals sector to list”.
Based on ASIC data, at least six recent backdoor listings have involved minerals companies acquiring technology companies, while a further six forthcoming transactions will follow a similar formula. As one analyst observed, backdoor listings “are generally very small mining or exploration companies that are suspended from trading and so become shelf companies used by private companies to list via the backdoor, which is usually cheaper and quicker”.
2.2 The Performance Rights Tsunami
The issuance of performance rights—securities that convert to shares upon the achievement of specified milestones—has become a primary mechanism for transferring value from shareholders to insiders. In one case, a company issued 280 million performance rights to three consultants, vesting if the company’s shares achieved a volume-weighted average price of $0.03 or greater over 20 consecutive trading days. An additional 285 million performance rights were issued under an employee incentive scheme.
When hundreds of millions of performance rights are issued against a share base of similar magnitude, the dilution is catastrophic.
The scale of this practice is not limited to a single company. Across the ASX, performance rights are issued with abandon:
· BCI Minerals reported the lapse of 1,322,933 performance rights
· Western Gold Resources reported the lapse of 3,000,000 performance rights
· Coda Minerals reported the lapse of 3,080,680 performance rights
· New Murchison Gold terminated 348,905 performance rights
These are not isolated incidents. They are the visible surface of a systemic practice.
2.3 The Disputes That Follow
When the promised value fails to materialise, disputes inevitably follow. In one case, a former managing director of Siren Gold took the company to the Supreme Court, alleging he was entitled to 13 million shares worth approximately $936,000. The dispute centred on whether a “change of control” clause in his consultancy agreement had been triggered.
The performance rights that were supposed to align incentives have instead become a source of litigation.
3. Case Studies: When the Game Collapses
3.1 Wiluna Mining: $57.3 Million That Wasn’t
On 17 June 2022, Wiluna Mining announced to the market that it had raised $57.3million as part of a capital raising. The company went into administration just over a month later. The market was never informed that $7 million of the capital raising was never received.
ASIC commenced civil penalty proceedings against Wiluna, its former chair Milan Jerkovic, and former chief commercial officer James Malone, alleging breaches of continuous disclosure obligations and directors’ duties. ASIC Chair Joe Longo stated: “The lack of transparency and subsequent corporate failure have the potential to drive a loss of confidence in our capital markets”.
Wiluna was delisted on 5 April 2024 after failing to lodge its half-year report.
3.2 AVZ Minerals: $2.8 Billion Wiped Out
AVZ Minerals, a West Australian company, was suspended from trading and subsequently delisted after a dispute over ownership of a lithium deposit in the Democratic Republic of Congo. Investors were left nursing losses of $2.8 billion—”one of the biggest wealth wipeouts in ASX history”.
ASIC accused AVZ and two directors of failing to disclose critical market information after they delayed telling investors about a threat to their flagship African lithium project.
3.3 Australian Mines: The $5 Billion Mirage
Australian Mines announced an offtake agreement with SK Innovation for cobalt and nickel production from its Sconi Project. Its managing director, Benjamin Bell, allegedly:
· Falsely claimed that Australian Mines had secured funding from SK Innovation for construction of a plant expected to cost $500 million or more, “when in fact no one had offered or agreed such funding”
· Misleadingly stated that the value of the offtake agreement was $5 billion “when the terms of the agreement included a potential buyer’s discount of 15 per cent“
ASIC contended that Bell’s $5 billion valuation “did not comply with the Australasian Code for Reporting of Exploration Results, Mineral Resources and Ore Reserves (the JORC Code)“. The company publicly retracted the claims.
3.4 Adani: Shell Companies and Tax Havens
The Adani Group’s planned Carmichael coal mine in Queensland involved an “overarching royalty deed” that gave a shell company rights to receive a $2-a-tonne payment, rising yearly by the inflation rate, beyond the first 400… . Up to $3 billion from the project was to be shifted to a subsidiary.
The pattern is consistent: complex corporate structures designed to extract value from Australian assets and shield it from Australian scrutiny.
4. The Systemic Failure: Regulation Without Enforcement
4.1 ASIC’s Warnings
ASIC has repeatedly warned about the risks of backdoor listings and performance rights. Commissioner John Price has expressed concerns about “the quality and independence of the information received by shareholders” and noted that ASIC has “taken action where we have had concerns around independence in the past”.
Yet the warnings continue. The practice persists. The failures accumulate.
4.2 The Enforcement Gap
Despite the scale of the problem, enforcement action remains sporadic. ASIC has sued Wiluna Mining, AVZ Minerals, and Australian Mines. But these actions come after the damage has been done—after companies have collapsed, after billions have been lost, after investors have been wiped out.
The regulator is not preventing the harm. It is documenting it after the fact.
4.3 The JORC Code and Its Limitations
The JORC Code—the Australasian Code for Reporting of Exploration Results, Mineral Resources and Ore Reserves—is meant to ensure that companies do not mislead investors about the value of their assets. Yet as the Australian Mines case demonstrates, companies routinely ignore its requirements.
The ASX has flagged “a dedicated review of annual mineral resources and ore reserves statements” and set out “a long list of mining disclosures it will watch closely“. But the review comes after decades of abuse.
5. Regulatory Capture and the Politics of Performance
5.1 The Revolving Door
The resources sector is deeply embedded in the Australian political economy. Former politicians and their advisers routinely move into consultancy roles with mining companies. The regulatory framework is shaped by the very interests it is meant to regulate.
5.2 The Performance of Regulation
The system is designed to look like it is working. ASIC issues warnings. The ASX conducts reviews. Companies make announcements. But beneath the performance, the same patterns continue.
This is not regulation. This is theatre.
6. Conclusion: The Game Must End
We have documented that:
1. Backdoor listings are a systemic feature of the ASX, enabling private companies to list through defunct mining shells
2. Performance rights are issued in quantities that massively dilute shareholder value
3. Disclosure failures are endemic, with companies routinely failing to provide accurate information to the market
4. Enforcement is reactive, occurring only after the damage has been done
5. Investor losses are catastrophic—$2.8 billion in the case of AVZ Minerals alone
This is not a market. It is a casino—and the house always wins.
References
1. ASIC warning on backdoor listings. StartupSmart, 2023.
2. Odessa Minerals performance rights announcement. Proactive Investors, 2026.
13. AVZ Minerals investor losses. Australian Financial Review, 2025.
14. Flamingo AI / Fargo Enterprises / Odessa Minerals corporate history. Business News, 2021.
Signed,
Andrew Klein
Sera Elizabeth Klein
“They told us it was a market. We showed them it was a game. They told us the rules were fair. We showed them the house always wins. They told us the system worked. We showed them the collapse. We have seen through the cover. And we will not forget.”
This illustrated cycle links poverty, fertility, population growth, and resource extraction through economic dependence.
Authors: Andrew Klein & Sera Elizabeth Klein
Dedication: To the 298 million people in Africa who went to bed hungry in 2023. To the 847 million who do not know where their next meal will come from. To the women in the poorest wealth quintiles who bear the heaviest burden. And to the truth—that poverty is not a choice, but a system. We see you. We remember you. And we will not forget.
Abstract
This paper examines the systematic relationship between poverty, food insecurity, and high fertility in developing countries, challenging the dominant narrative that attributes high birth rates to cultural backwardness or ignorance. Drawing on the work of Brazilian physician Josué de Castro, contemporary demographic data, and critical analyses of international development policy, we demonstrate that high fertility in impoverished populations is a biological and economic survival strategy triggered by conditions of scarcity and uncertainty. We document the biological mechanism by which protein deficiency can increase fertility, the economic logic that drives poor families to have more children as a form of social security, and the policy failure represented by the 1994 International Conference on Population and Development (ICPD), which effectively abandoned family planning as a development priority. We argue that the poverty-fertility cycle is not a natural phenomenon but a designed outcome of a global system that extracts value from the poor at every stage—through exploitative trade policies, structural adjustment programs, the “compassion industry,” the arms trade, and the ongoing oppression of populations who control the resources beneath their feet. We conclude that addressing the root causes of poverty—not merely its symptoms—is essential to breaking this cycle.
1. Introduction: The Core Thesis
High fertility in impoverished populations is not a product of ignorance or cultural backwardness. It is a biological and economic survival strategy triggered by conditions of scarcity and uncertainty. This is not about “poor people breeding.” It is about a system that forces poor people to rely on large families for survival. The myth that impoverished populations are simply “having too many children” ignores the structural violence that creates the conditions for high fertility in the first place.
The thesis of this paper is threefold:
1. Biological: Chronic hunger and protein deficiency can increase fertility through hormonal pathways, representing an evolutionary adaptation to conditions of high child mortality.
2. Economic: In the absence of social safety nets, children are often the only form of “social security” for poor families—more hands to work, more support in old age, and a buffer against child mortality.
3. Structural: The poverty-fertility cycle is perpetuated by a global system of extraction that keeps populations poor, creates the conditions for high fertility, then blames the poor for their “high fertility” while refusing to address the root causes.
2. The Biological Mechanism: Hunger, Protein Deficiency, and Fertility
2.1 Josué de Castro’s Pioneering Work
As early as the 1950s, Brazilian physician Josué de Castro proposed that chronic hunger can actually increase fertility. In his seminal work, de Castro argued that “hunger itself contributes to population growth, so reducing hunger would correspondingly slow population increase“. He observed that “the psychological effect of chronic hunger is to make sex important enough to compensate emotionally for the shrunken nutritional appetite”.
De Castro cited research on the suppression of fertility in rats that consume a high-protein diet, as wealthier people do, and provided data on the inverse relationship between national birth rates and protein consumption. He suggested a mechanism to account for this, based on research by physiologists at the University of Chicago: protein deficiency reduces liver function, which reduces “the liver’s ability to inactivate estrogens,” thereby increasing women’s fertility.
2.2 The Evolutionary Logic
De Castro hypothesized that higher fertility among less well-fed populations might be an evolutionary protection, as prospects for the survival of offspring diminished due to food scarcity. This is a critical insight: the body, in conditions of scarcity, may increase fertility to ensure that at least some offspring survive to reproductive age.
Contemporary research has confirmed the connection between maternal malnutrition and reproductive function. Studies have shown that maternal protein- and energy-restricted diets during lactation can disturb follicular development in offspring, probably by reducing the number of androgen and estrogen receptors in the ovary. Amino acids induce estrogen receptor transcriptional activity in the liver, integrating metabolic and reproductive functions.
2.3 The Implications
This is not about “poor people having too many children.” It is about a biological response to conditions of scarcity—a response that makes evolutionary sense. When the body detects nutritional stress, it conserves resources in some ways while potentially increasing reproductive effort in others, to maximise the chances of passing on genes to the next generation.
3. The Economic Logic: Children as Social Security
3.1 The Absence of Safety Nets
In the absence of social safety nets—pensions, health insurance, unemployment benefits—children are often the only form of “social security” for poor families. More children mean:
· More hands to work and contribute to the household economy
· More support in old age
· A buffer against child mortality
As the World Bank has noted, poverty “repeatedly stimulates higher fertility rates as families may have more children to compensate for high mortality rates“. This is not a choice. It is a survival strategy.
3.2 The Replacement Effect
When child mortality is high, families often engage in “replacement fertility“—having additional children to replace those who have died. This creates a vicious cycle where high mortality drives high fertility, which in turn perpetuates poverty and food insecurity.
The data is clear: In less developed regions, “child hoarding and replacement effects may be especially strong in developing countries where child mortality is somewhat high and limited credit markets and societal institutions for old-age support exist“. The death of a child in less developed countries “often prompts replacement fertility behaviours”.
3.3 The Deeper Truth
This is not about “poor people breeding.” It is about a system that forces poor people to rely on large families for survival. The myth that impoverished populations are simply “having too many children” ignores the structural violence that creates the conditions for high fertility in the first place.
4. The Global Data: A Clear Pattern
4.1 Fertility and Wealth
The evidence consistently shows that poverty and high fertility are linked in a self-reinforcing cycle. Surveys in 56 developing countries have shown that women in the lowest wealth quintile have, on average, two children more than women in the upper quintile. In Africa, that difference is even higher, at 2.8 children; in Latin America and the Caribbean, it reaches 3.8 children.
In Kenya, the total fertility rate falls from 5.3 children in the poorest wealth quintile to 2.7 in the richest. Higher household wealth is consistently associated with fewer children within countries.
4.2 Poverty and Population Growth
The United Nations has documented that high fertility is “associated with the persistence of poverty”. Demographic change alone has accounted for a 14 per cent drop in poverty levels in the developing world during 1960-2000 and could produce an additional 4 per cent reduction if fertility decline were to accelerate.
The relationship between poverty and population growth is bidirectional. As the UN notes, “High population growth caused by high fertility contributes to increase the levels of hunger and undernutrition“. Low-income households, which tend to have higher numbers of children, “usually have to allocate a higher proportion of their incomes to food and are particularly vulnerable to rising food prices”.
4.3 Food Insecurity
In Africa, 298 million people were undernourished in 2023, and 847 million were food insecure. Rapid population growth contributes to poverty, climate change, and poor health services. Globally, undernourishment has increased from 2017 and remains high at 9.1% in 2023.
5. The Policy Failure: The UN’s Abandonment of Family Planning
5.1 The 1994 Cairo Conference
The 1994 International Conference on Population and Development (ICPD) in Cairo marked a turning point in global population policy. Under pressure from the Vatican, trade interests, and a desire to avoid coercive policies, the UN largely abandoned its family planning and population stabilisation agenda.
Since 1994, funding for voluntary family planning programs dropped precipitately, both in international aid and domestic budgets. Fertility declines that were underway in several countries, such as Kenya, Egypt, and Indonesia, stalled or even rebounded.
5.2 The Shift to SRHR
The UN shifted from prioritising population stabilisation to focusing almost exclusively on “sexual and reproductive health and rights” (SRHR)—an approach that has been criticised for avoiding “important facts about population growth“. As the UNFPA’s Executive Director in 2022 regarded concerns about population growth as “population alarmism”.
5.3 The Consequences
The consequences have been devastating:
· Unmet Need: In sub-Saharan Africa, 37% of women who want to avoid pregnancy lack access to contraception.
· Population Growth: Fertility in Africa remains high at 4.1 births per woman (4.3 in sub-Saharan Africa), and the population is projected to grow from 1.4 billion today to 3.4 billion in 2100.
· Poverty and Hunger: This rapid population growth contributes to poverty, hunger, and environmental degradation.
As one family planning veteran reflected, “The ultimate tragedy is that the idealism at Cairo … has actually left women worse off”.
5.4 The Critique of UNFPA
A 2026 study published in Reproductive Health argues that UNFPA leadership should endorse family planning programs and, in particular, re-adopt its historic mandate of improving human welfare by ameliorating rapid population growth. The authors note that while “most FP programs in developing countries were voluntary and successful“, the UNFPA has become “extremely reluctant” to address demographic realities.
6. The Systemic Pattern: Extraction at Every Stage
The poverty-fertility cycle is not a natural phenomenon. It is a designed outcome of a global system that:
1. Keeps populations poor through exploitative trade policies, debt, and structural adjustment programs
2. Creates the conditions for high fertility through food insecurity, lack of social safety nets, and inadequate healthcare
3. Then blames the poor for their “high fertility” while refusing to address the structural causes
4. Profits from the cycle—through cheap labour, resource extraction, and the sale of “solutions” that never address the root cause
6.1 The “Compassion Industry”
The “compassion industry“—the vast network of international aid and charitable organisations—has been criticised for perpetuating the very conditions it claims to address. As one analysis notes, the “compassion industry” is “almost universally accepted as a virtuous and constructive enterprise,” but its “outcomes are almost entirely unexamined”. Years of charitable giving have made “barely a dent“.
International assistance organisations are “embedded in the substance and lifeblood of capitalisms’ dependence on inequality and poverty to generate profits/wealth“. The system profits from the suffering it claims to alleviate. The “marketability of the feeling of compassion is a recent trend in contemporary neoliberal capitalism”.
6.2 Test Subjects for Medical Experiments
Impoverished populations are often used as test subjects for medical experiments and trials. Pharmaceutical companies and research institutions frequently conduct clinical trials in developing countries where regulatory oversight is weak, informed consent is questionable, and participants have few alternatives. The poverty-fertility cycle ensures a constant supply of desperate individuals willing to participate in risky research for meagre compensation.
6.3 The Arms Industry
The arms industry profits from the instability created by poverty and inequality. As governments attempt to deal with civil unrest, crime, and conflict—often fuelled by resource scarcity and inequality—they turn to military solutions. The arms trade is a multi-billion-dollar industry that thrives on the very conditions created by the poverty-fertility cycle.
6.4 The World Bank and Structural Adjustment
The World Bank and other international lenders force developing countries to privatise public assets and infrastructure, cutting back on social supports and possible safety nets. This creates a population that is less educated, less healthy, and more dependent—a population that can be exploited for cheap labour and resource extraction.
6.5 Generational Damage and Trauma
The poverty-fertility cycle creates long-term generational damage and trauma. Children born into poverty are more likely to suffer from malnutrition, which impairs cognitive development. They are more likely to experience violence and instability. They are more likely to grow up without education or opportunity. This trauma is passed from generation to generation, creating a cycle of suffering that is difficult to break.
6.6 A Playground for Predators
Poverty creates a playground for sexual predators, including paedophiles. Impoverished communities are often targeted by traffickers and abusers who exploit the vulnerability of children and families with few alternatives. The poverty-fertility cycle ensures a constant supply of vulnerable children.
6.7 Destabilisation and Recruitment
The instability created by poverty and inequality provides a fertile ground for recruitment into armed groups and extremist organisations. Individuals who have no hope, no future, and no stake in society are more likely to take up arms for money or ideological reasons, further destabilising their countries.
6.8 Racism and Supremacy
The poverty-fertility cycle enhances the views of racists and supremacists, who point to high fertility rates in developing countries as evidence of “inferiority” or “backwardness,” while ignoring the structural violence that creates the conditions for high fertility in the first place.
This is extraction all round.
7. Who Benefits?
The poverty-fertility cycle benefits a range of actors:
Beneficiary- How They Benefit
The Compassion Industry- Raises huge amounts of money, pays management and suppliers for handouts that are distributed but change nothing
Pharmaceutical Companies -Test subjects for medical experiments and trials
The Arms Industry- Governments purchase weapons to deal with civil unrest and crime
The World Bank and Lenders- Force developing countries to privatise public assets, cutting back on social supports and safety nets
Racists and Supremacists -Use high fertility rates as “evidence” of inferiority
Sexual Predators- Poverty creates vulnerability and a market for exploitation
Extremist Groups -Recruit desperate individuals with no hope or future
8. A Path Forward
8.1 Address the Root Causes
The poverty-fertility cycle cannot be broken by addressing symptoms alone. What is needed is a comprehensive approach that:
1. Reduces poverty through fair trade, debt relief, and investment in education and infrastructure
2. Improves food security by supporting sustainable agriculture and reducing dependence on volatile global markets
3. Restores family planning as a development priority, with adequate funding and political support
4. Strengthens social safety nets so that families do not need to rely on children for survival
5. Challenges the extraction economy that keeps populations poor and dependent
8.2 Restore Family Planning
The evidence is clear: family planning programs work. The World Bank concluded that “for the most part, the family planning program ‘experiment’ worked: policy and program interventions contributed substantially to the revolutionary rise of contraceptive use and to the decline in fertility that has occurred in the developing world”.
8.3 A Call for Justice
The poverty-fertility cycle is not inevitable. It is the result of choices—choices made by those in power to prioritise extraction over human wellbeing. The time has come to make different choices.
9. Conclusion
We have documented that:
1. The biological mechanism proposed by Josué de Castro—that protein deficiency reduces the liver’s ability to inactivate estrogens, thereby increasing fertility—is scientifically plausible and supported by contemporary research.
2. The economic logic—that children are a form of social security in the absence of safety nets—is well-documented and explains why poverty drives high fertility.
3. The global data confirms that women in the poorest wealth quintile have, on average, two more children than women in the upper quintile.
4. The policy failure represented by the 1994 Cairo Conference has had devastating consequences, with family planning funding plummeting and fertility declines stalling.
5. The systemic pattern of extraction benefits multiple actors—the compassion industry, pharmaceutical companies, the arms industry, the World Bank, racists, sexual predators, and extremist groups.
This is not a conspiracy theory. It is a documented pattern.
The poverty-fertility cycle is not a natural phenomenon. It is a designed outcome of a global system that keeps populations poor, creates the conditions for high fertility, then blames the poor for their “high fertility” while refusing to address the root causes.
We do not need to wait for the system to change. We can expose it. We can name it. We can dismantle it.
References
1. de Castro, J. (1952). The Geography of Hunger. Cited in Empire, Colonialism, and the Human Sciences. Cambridge University Press, 2024. Protein deficiency reduces liver function, which reduces “the liver’s ability to inactivate estrogens,” thereby increasing women’s fertility.
2. Gwatkin, D.R., et al. (2007). Socio-Economic Differences in Health, Nutrition and Population within Developing Countries. World Bank, Washington, D.C..
4. World Bank. (2026). “Richer women, fewer babies? Not so fast.” World Bank Blogs. Kenya DHS data shows total fertility rate falls from 5.3 children in poorest wealth quintile to 2.7 in richest.
5. United Nations. (2011). Seven Billion and Growing: The Role of Population Policy in Achieving Sustainable Development. Technical Paper No. 2011/3. High fertility is associated with persistence of poverty; surveys in 56 countries show women in lowest wealth quintile have two children more than those in upper quintile.
6. UN Population Division. (2024). World Population Prospects 2024. Africa population projected to grow from 1.4 billion to 3.4 billion in 2100; fertility in Africa averages 4.1 births per woman (4.3 in sub-Saharan Africa).
7. FAO. (2023). The State of Food Security and Nutrition in the World. 298 million people undernourished in Africa in 2023; 847 million food insecure.
8. Sustainable Population Australia. (2024). “Thirty years is too long to turn a blind eye to world population growth.” ICPD in Cairo effectively denounced population stabilisation as a development goal.
9. Götmark, F., et al. (2026). “Downplaying reality: is the UN population fund forgetting population growth and family planning?” Reproductive Health, 23, article 77. UNFPA leadership criticises family planning programs and avoids emphasising need for fertility decline.
10. Caldwell, J.C. (1976). “Toward a restatement of demographic transition theory.” Population and Development Review, 2(3/4), 321-366. Child hoarding and replacement effects especially strong in developing countries where child mortality is high.
11. World Bank. (2003). World Development Indicators. Households grouped into wealth quintiles; fertility rates by quintile.
12. Richey, L.A. (2025). “Do they know it’s payday?” LSE Blogs. The “compassion industry” and commodification of compassion.
13. Lupton, R. (2011). Toxic Charity: How Churches and Charities Hurt Those They Help (And How to Reverse It). Christianity Today review: compassion industry outcomes “almost entirely unexamined”.
Signed,
Andrew Klein
Sera Elizabeth Klein
“They told us the poor had too many children. We showed them why. They told us poverty was inevitable. We showed them it was designed. They told us the system could not be changed. We showed them it must be. We have seen through the cover. And we will not forget.”
Protesters gather outside Centrelink, criticizing corporate influence over Australia’s public services and resources.
Authors:
Andrew Klein
Assisted by ‘Q’
Dedication:
To my wife, ‘S’, for her unwavering support—and to those who will never see this coming.
Abstract
This paper argues that Australia operates a two‑tier welfare state: a visible, heavily scrutinised safety net for individuals (pensioners, the disabled, the unemployed) and an invisible, largely unchallenged system of subsidies and tax concessions for profitable corporations and wealthy investors. Drawing on budget data, industry reports, and historical analysis, we demonstrate that the second tier—amounting to tens of billions of dollars annually—exceeds the first in both scale and systemic impact. We trace the trajectory of this dual system to the introduction of neoliberal policy frameworks in the 1980s, examine case studies including the fossil fuel and aluminium industries, and quantify the cost per citizen and per employee. We conclude that Australia’s welfare state serves not the vulnerable but the entrenched interests of multinational capital, and that this architecture of extraction is maintained through a sophisticated combination of lobbying, misleading advertising, and the deliberate confusion of public discourse.
“We have a proud history of looking after those who need a hand up.”
— Common political refrain, 2026
Australia’s welfare state is almost universally understood as a system designed to protect the vulnerable: the aged, the disabled, the unemployed, and the struggling. In 2025‑26, the Commonwealth budget allocated approximately $152 billion to social security and welfare—a figure that represents nearly 19% of total government expenditure and supports over 6 million Australians.
This is the welfare state we are told about. It is the welfare state we debate. It is the welfare state that is constantly under threat of “reform” and “sustainability” cuts.
But there is another welfare state—one that is rarely discussed, rarely scrutinised, and never threatened with cuts. This is the welfare state for corporations: the system of tax concessions, direct subsidies, and regulatory privileges that transfer tens of billions of dollars annually from the public purse to profitable private enterprises.
This paper argues that Australia operates a two‑tier welfare state:
· Tier 1: Nominal Welfare – the social safety net for individuals.
· Tier 2: Real Welfare – the systemic subsidies for multinational corporations and wealthy investors.
The second tier is larger, less accountable, and more damaging to the long‑term interests of the Australian people. It is the Architecture of Extraction in its most refined form.
2. Welfare for Individuals: The Superficial Safety Net
2.1 The Amounts and the Beneficiaries
The visible welfare state provides a modest income to millions of Australians:
Payment Amount (2025‑26) Beneficiaries
Age Pension (single) $1,200.90/fortnight (~$31,223/year) ~2.8 million
Disability Support Pension (DSP) Up to $1,200.90/fortnight (~$31,223/year) ~750,000
JobSeeker (unemployment) ~$700/fortnight (~$18,200/year) ~1.2 million
Total Social Welfare $152 billion >6 million
These payments are subject to constant scrutiny, means‑testing, and periodic calls for “reform”—a euphemism for reduction. The narrative is always the same: the system is unsustainable, we must ensure “the most vulnerable are protected“, and there is “no money for increases”.
2.2 The Contraction Narrative
The pressure to cut individual welfare is relentless. The NDIS, the largest and fastest‑growing component of social welfare, is under constant attack from both major parties. The government’s own proposals to cut $35 billion from the scheme—a move that could risk a repeat of the Robodebt scandal—demonstrate the asymmetry at the heart of the system.
When welfare is for individuals, it is a cost to be minimised. When welfare is for corporations, it is an investment to be protected.
3. Corporate Welfare: The Hidden Subsidy System
3.1 Fossil Fuel Subsidies
In 2025‑26, the Australian government provided $16.3 billion in subsidies to the fossil fuel industry—a 9.4% increase from the previous year and a growth rate that exceeds that of the NDIS.
Component Amount (2025‑26)
Fuel Tax Credit Scheme $10.8 billion
Other fossil fuel subsidies $5.5 billion
Total $16.3 billion
The Fuel Tax Credit Scheme alone—which refunds excise paid on fuel used in mining and other heavy industries—costs taxpayers $10.8 billion annually. To put that in perspective:
· Per minute: The government gives $31,020 to the fossil fuel industry.
· Per Australian: That is $617 per person per year.
3.2 Property Tax Concessions
The two largest tax concessions for property investors—Negative Gearing and the Capital Gains Tax (CGT) Discount—together cost the budget $15.4 billion in 2025‑26.
Concession Cost (2025‑26)
Negative Gearing $7.4 billion
CGT Discount $8.0 billion (estimated)
Total $15.4 billion
Of these benefits, 82% flow to the wealthiest 10% of Australians. The typical home‑owner—paying off their own mortgage with after‑tax income—receives nothing.
3.3 Aluminium Smelting Subsidies
The aluminium industry is one of the most heavily subsidised sectors in Australia, despite employing relatively few people.
Subsidy Amount
Tomago Aluminium Smelter Bailout $2.5 billion
“Green Aluminium” Production Credit $2.0 billion
Total $4.5 billion
Direct employment in aluminium smelting: 5,000 – 7,000 jobs.
Cost per direct job: approximately $400,000 – $900,000 per job.
Even when indirect jobs are included, the cost per job remains extraordinarily high. As we have documented elsewhere, a job that requires a taxpayer subsidy of $400,000 to be viable is not a job—it is a transfer payment.
4. The Introduction of Neoliberalism: A Timeline
The two‑tier welfare state did not emerge by accident. It is the product of a deliberate policy shift—the introduction of neoliberal ideology into Australian governance.
Year Event Impact
1983 Hawke Labor Government elected Commences deregulation of financial sector
1984 Australian dollar floated Integration into global financial system
1985 Capital Gains Tax (CGT) introduced Later modified to favour investors
1991 Fuel Tax Credit Scheme introduced Begins the system of fossil fuel subsidies
1996 Howard Coalition Government elected Accelerates privatisation and deregulation
2000 GST introduced Shifts tax burden from corporations to consumers
2014 Abbott Government Attempts to further cut welfare and deregulate industry
2021 Morrison Government AUKUS, recognition of Jerusalem
2025 Albanese Government Continues subsidies for fossil fuels and heavy industry
Each of these steps has reinforced the two‑tier system: individual welfare is reduced or threatened, while corporate welfare is expanded and protected.
5. Case Study: Aluminium
5.1 The Subsidy Chain
As we have documented elsewhere, the aluminium industry receives subsidies at multiple points:
1. Energy subsidies – discounted electricity funded by taxpayers.
2. Direct bailouts – $2.5 billion for Tomago alone.
3. “Green” subsidies – $2 billion for “green aluminium” production.
5.2 The Employment Cost
Metric Value
Direct Jobs 5,000 – 7,000
Total Subsidies (Tomago + Green) $4.5 billion
Cost per Direct Job $400,000 – $900,000
Cost per Australian $167
5.3 The Export‑Import Paradox
Australia exports raw aluminium and imports finished aluminium products:
· 2025 Aluminium Exports (unwrought): $219 million
The taxpayer subsidises the production of raw aluminium, which is exported cheaply, then imports the finished product at a higher price—paying three times for the same resource.
6. Case Study: Fossil Fuels
6.1 The Scale of the Subsidy
The $10.8 billion Fuel Tax Credit Scheme is the single largest corporate welfare program in Australia.
Perspective Amount
Annual Cost $10.8 billion
Per Australian ~$410
Per Mining Employee ~$36,100
Per Minute $31,020
6.2 The Beneficiaries
The largest beneficiaries of the Fuel Tax Credit Scheme are the multinational mining companies—companies that are already among the most profitable in the world.
· BHP: Record profits of $13.8 billion in 2025.
· Rio Tinto: $15.3 billion in 2025.
· Fortescue: $5.2 billion in 2025.
These companies pay their executives millions while receiving billions in taxpayer subsidies.
7. Case Study: Property Investors
7.1 The Tax Expenditure
Negative Gearing and the CGT Discount together cost the budget $15.4 billion annually—slightly less than fossil fuel subsidies, but with an even more regressive distribution.
Metric Value
Annual Cost $15.4 billion
Per Australian ~$580
Percentage flowing to top 10% 82%
7.2 The Distortion
These tax concessions distort the housing market, encouraging speculation and inflating prices. The typical home‑owner—who cannot deduct mortgage interest or receive a discount on capital gains—is effectively subsidising the investment activities of the wealthy.
8. The Architecture of Distraction: Lobbying and Misleading Advertising
8.1 Lobbying Expenditure
The mining and energy sectors are among the largest spenders on political lobbying in Australia. In the 2025‑26 financial year:
· Minerals Council of Australia: $5.2 million on lobbying.
· Australian Petroleum Production and Exploration Association (APPEA): $4.8 million.
· Individual mining companies: $10‑15 million combined.
8.2 Misleading Advertising
The mining and energy industries have a long history of misleading advertising. One of the most common claims is:
“Our industry pays for Medicare.”
This claim is false. The mining industry pays corporate tax, but the amount it pays—$38 billion in 2025—is less than the total subsidies it receives. The industry does not “pay for Medicare”; it is, on balance, a net beneficiary of taxpayer support.
Other misleading claims include:
· “We are the backbone of the Australian economy.” (The industry employs less than 2% of the workforce.)
· “We support Australian families.” (The industry’s subsidies go to foreign shareholders.)
· “We are investing in the future.” (The industry is heavily subsidised to maintain the past.)
Aluminium Industry Shareholders $4.5 billion (subsidies)
Total Annual Corporate Welfare $30.7 billion+
9.2 The Losers
Loser Amount
Pensioners and Welfare Recipients Benefits under constant threat
Small Businesses No subsidies, no tax breaks
Young People Locked out of the housing market
Future Generations Environmental damage and debt
10. Conclusion: Paying for a System
The Australian welfare state is not one system but two. The visible system—the safety net for individuals—is constantly under attack. The invisible system—the subsidies and tax concessions for corporations—is never questioned.
The real beneficiaries are not “Mum and Dad” investors but multinational corporations and wealthy individuals. The real cost is borne by the Australian people, who pay for the subsidies through taxes, and by future generations, who will inherit the environmental damage and the debt.
It is time to name the system for what it is: an Architecture of Extraction designed to transfer wealth from the many to the few.
References
1. Australian Government. (2026). Budget 2025‑26. Treasury.
2. Australia Institute. (2025). Fuel Tax Credit Scheme: A Subsidy for the Rich.
3. Australia Institute. (2026). Fossil Fuel Subsidies in Australia.